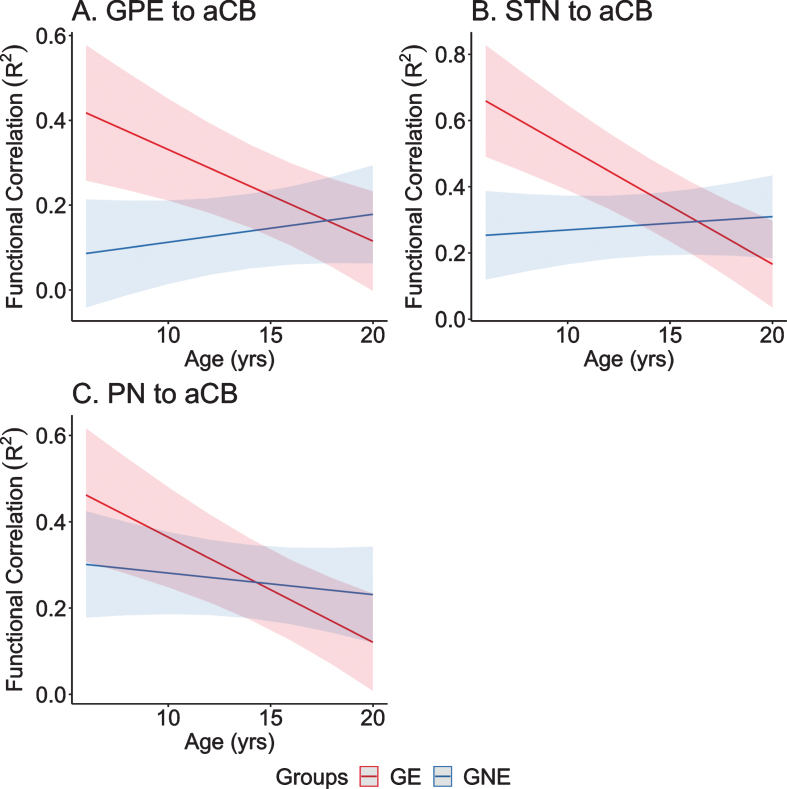
Fig. 8.
A–C) Predicted values from a linear mixed effects regression model of the functional connectivity (R2) between the striatal–cerebellar regions of interest (dependent variables) over time between groups (age×group interaction term). The model controlled for age, sex, and scanner, and included a sex×group interaction term and a random effect term per the participant’s slope of age, and a random effect term per family to account for participants who were siblings. aCB, anterior lobe of the cerebellum; dPU, dorsocaudal putamen; GE, gene-expanded; GNE, gene nonexpanded; GPE, globus pallidus externus; PN, pontine nucleus; STN, subthalamic nucleus.

