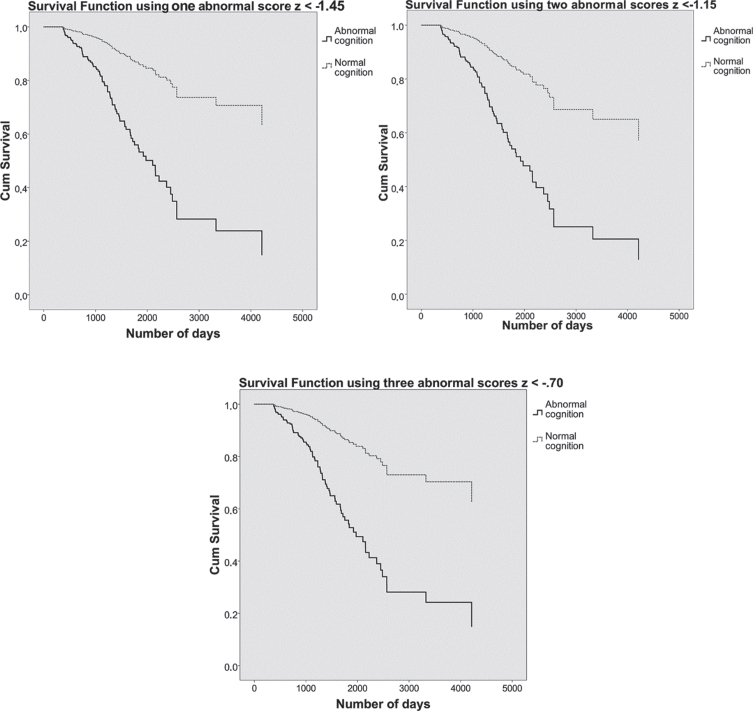
Fig. 3.
On the top left, the survival curves using one abnormal score of z < –1.45 are plotted. On the top right, the survival curves using two abnormal scores of z < –1.15. Below, the survival curves using three abnormal scores of z < –0.70. Patients with normal cognition are shown in dashed grey lines and patients with abnormal cognition in solid black lines. The y-axis shows cumulative (dementia free) survival across time, number of days participated is plotted on the x-axis.

