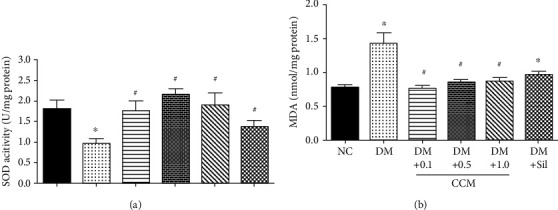
Figure 7.

Effect of CCM on testicular SOD and MDA after 3-week administration. (a) SOD activity. (b) MDA level. Values represent mean ± SD(N = 10/group).∗P < 0.05 compared with the normal control group, and #P < 0.05 compared with the DM control group.
