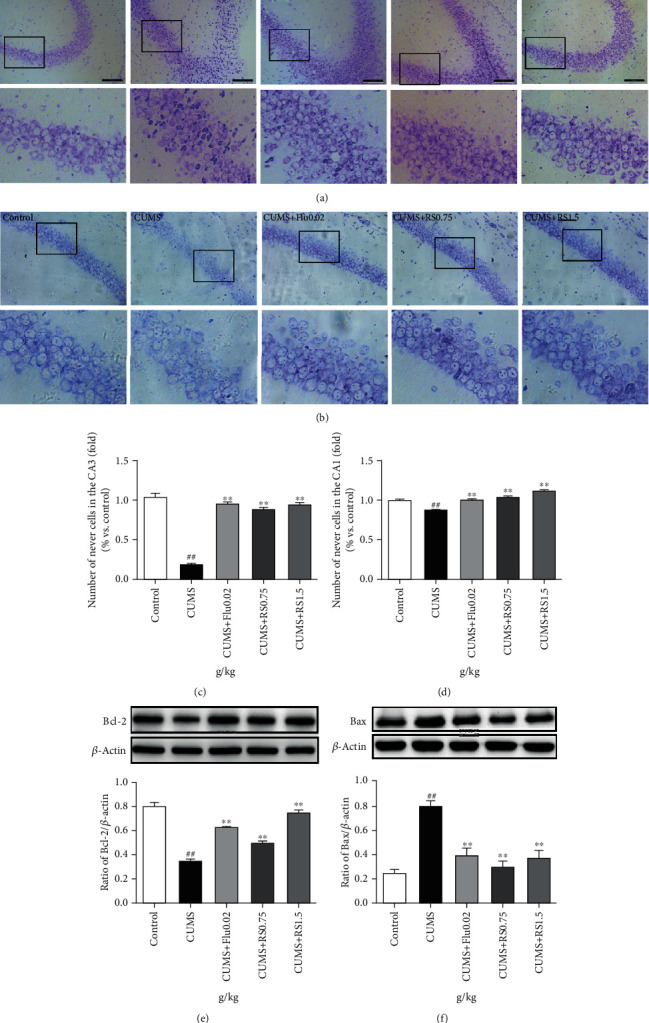
Figure 5.

Nissl staining and effects of RS on apoptosis in the hippocampus. (a) Nissl staining in the CA3 area. (b) Nissl staining in the CA1 area. (c) Number of positive cells in the CA3 area. (d) Number of positive cells in the CA1 area. (e) Effect of RS on the Bcl-2 protein. (f) Effect of RS on the BAX protein. Results are reported as means ± SEM (n = 3). ##p < 0.01 versus the control group; ∗∗p < 0.01 versus the CUMS group. Scale bar, 100 μm.
