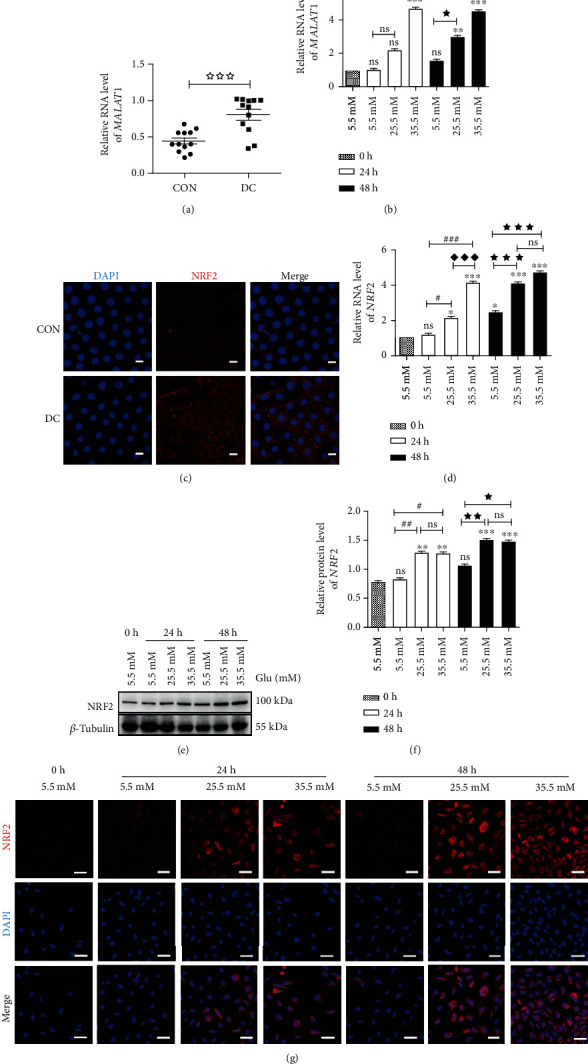
Figure 2.

Elevated expressions of MALAT1 and NRF2 in lens epithelial cells of diabetic patients and HLE-B3 cells stimulated by high glucose. (a) MALAT1 expression in lens epithelium of diabetic cataracts and (b) HLE-B3 cells induced by high glucose, using actin as the internal control. (c) Immunofluorescent images of NRF2 in lens epithelial cells on anterior lens capsules. Red represents NRF2 and blue represents nuclear DNA staining by DAPI, bars = 10μm. (d) NRF2 expression in HLE-B3 cells induced by high glucose, using actin as the internal control. (e) The expressions of NRF2 in HLE-B3 cells, using β-tubulin as the internal control, and quantified (f). n = 3. (g) Immunofluorescent images of NRF2. Red represents NRF2 staining and blue represents nuclear DNA staining by DAPI, bars = 50μm. ns means P > 0.05, one symbol means P < 0.05, two symbols mean P < 0.01, and three symbols mean P < 0.001. n = 3. ☆ vs. diabetic cataract group, ∗vs. group 5.5 mM at 0 h, # vs. group 5.5 mM at 24 h, ◆ vs. group 25.5 mM at 24 h, ★ vs. group 5.5 mM at 48 h, and ▲ vs. group 25.5 mM at 48 h.
