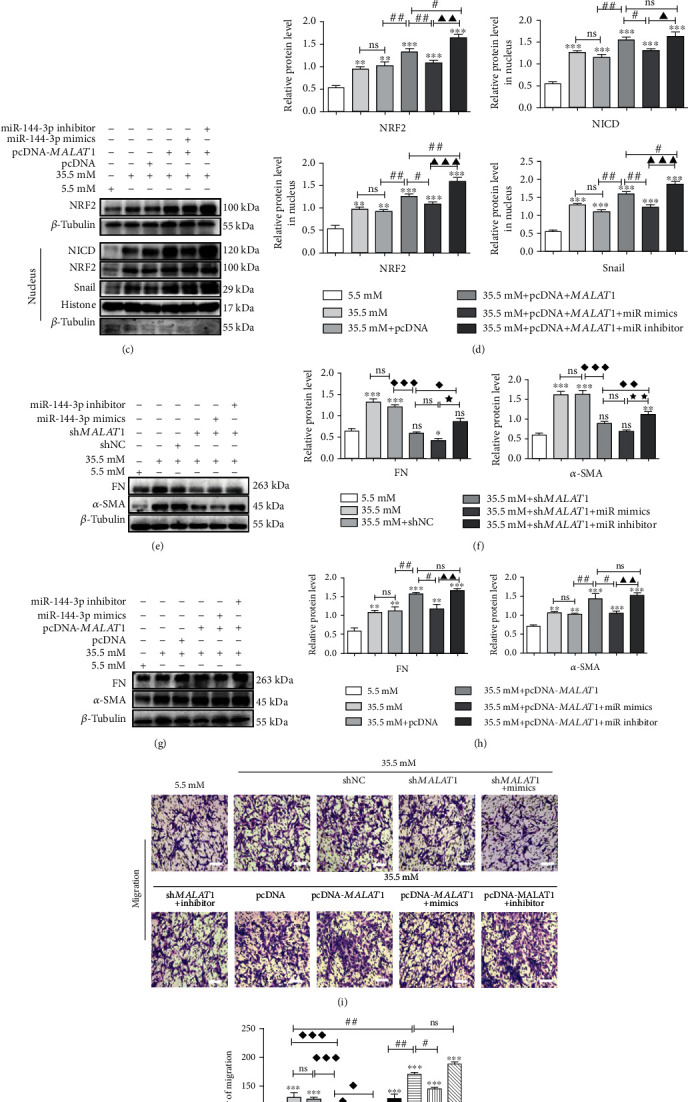
Figure 6.

MALAT1 promotes EMT and migration via sponge miR-144-3p through the NRF2/Notch1/Snail pathway in HLE-B3 cells. After cotransfection of miR-144-3p mimics, miR-144-3p inhibitor, miR-144-3p mimics NC, or miR-144-3p inhibitor NC with shNC, shMALAT1, pcDNA3.1, and pcDNA3.1-MALAT1 quantification of miR-144-3p and NRF2 RNA expression in HLE-B3 cells, HLE-B3 cells were cultured in complete DMEM containing 5.5 and 35.5 mM glucose for 24 h. (a, c) The expressions of NRF2, NICD, and Snail were detected by western blot with β-tubulin and histone as the internal control, and quantified (b, d). n = 3. (e, g) The expressions of FN and α-SMA were detected by western blot with β-tubulin as the internal control, and quantified (f, h). n = 3. After cotransfection, the migration ability of HLE-B3 cells stimulated by high glucose was detected by Transwell assay (i, j), bars = 100μm. ns means P > 0.05, one symbol means P < 0.05, two symbols mean P < 0.01, and three symbols mean P < 0.001. n = 3. ∗vs. 5.5 mM group, ◆ vs. 35.5 mM+shMALAT1 group, ★ vs. 35.5 mM+shMALAT1+miR-144-3p mimics group, # vs. 35.5 mM+pcDNA3.1-MALAT1 group, and ▲ vs. 35.5 mM+pcDNA3.1-MALAT1+miR-144-3p mimics group.
