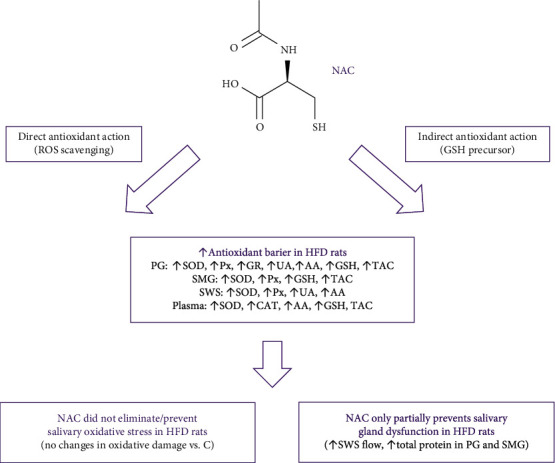
Figure 5.

Graphical presentation of conclusions from the research. AA: ascorbic acid; CAT: catalase; NAC: N-acetylcysteine; GR: glutathione reductase; GSH: reduced glutathione; HFD: high-fat diet; Px: salivary peroxidase; PG: parotid glands; SMG: submandibular glands; SOD: superoxide dismutase; SWS: stimulated whole saliva; TAC: total antioxidant capacity; UA: uric acid.
