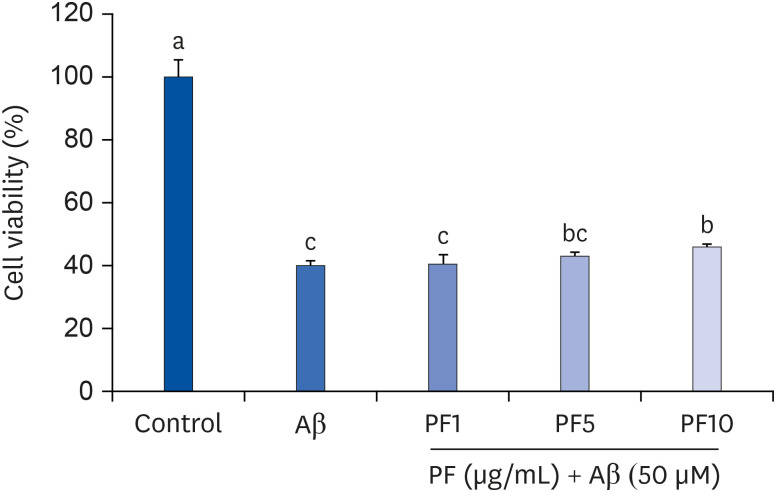
Fig. 1. Effect of PF on the viability in Aβ25–35-treated C6 glial cells. ‘Control’ represents non-treated cells, ‘Aβ’ represents Aβ25–35-treated cells, ‘PF1’, ‘PF5’, or ‘PF10’ represent the 3 concentrations of PF treatment (1, 5, and 10 μg/mL, respectively) in Aβ25–35-treated cells. Values are mean ± SD.
Aβ, amyloid beta; PF, paeoniflorin.
a-cMeans with different letters are significantly different (P < 0.05) as determined by Duncan's multiple range test.

