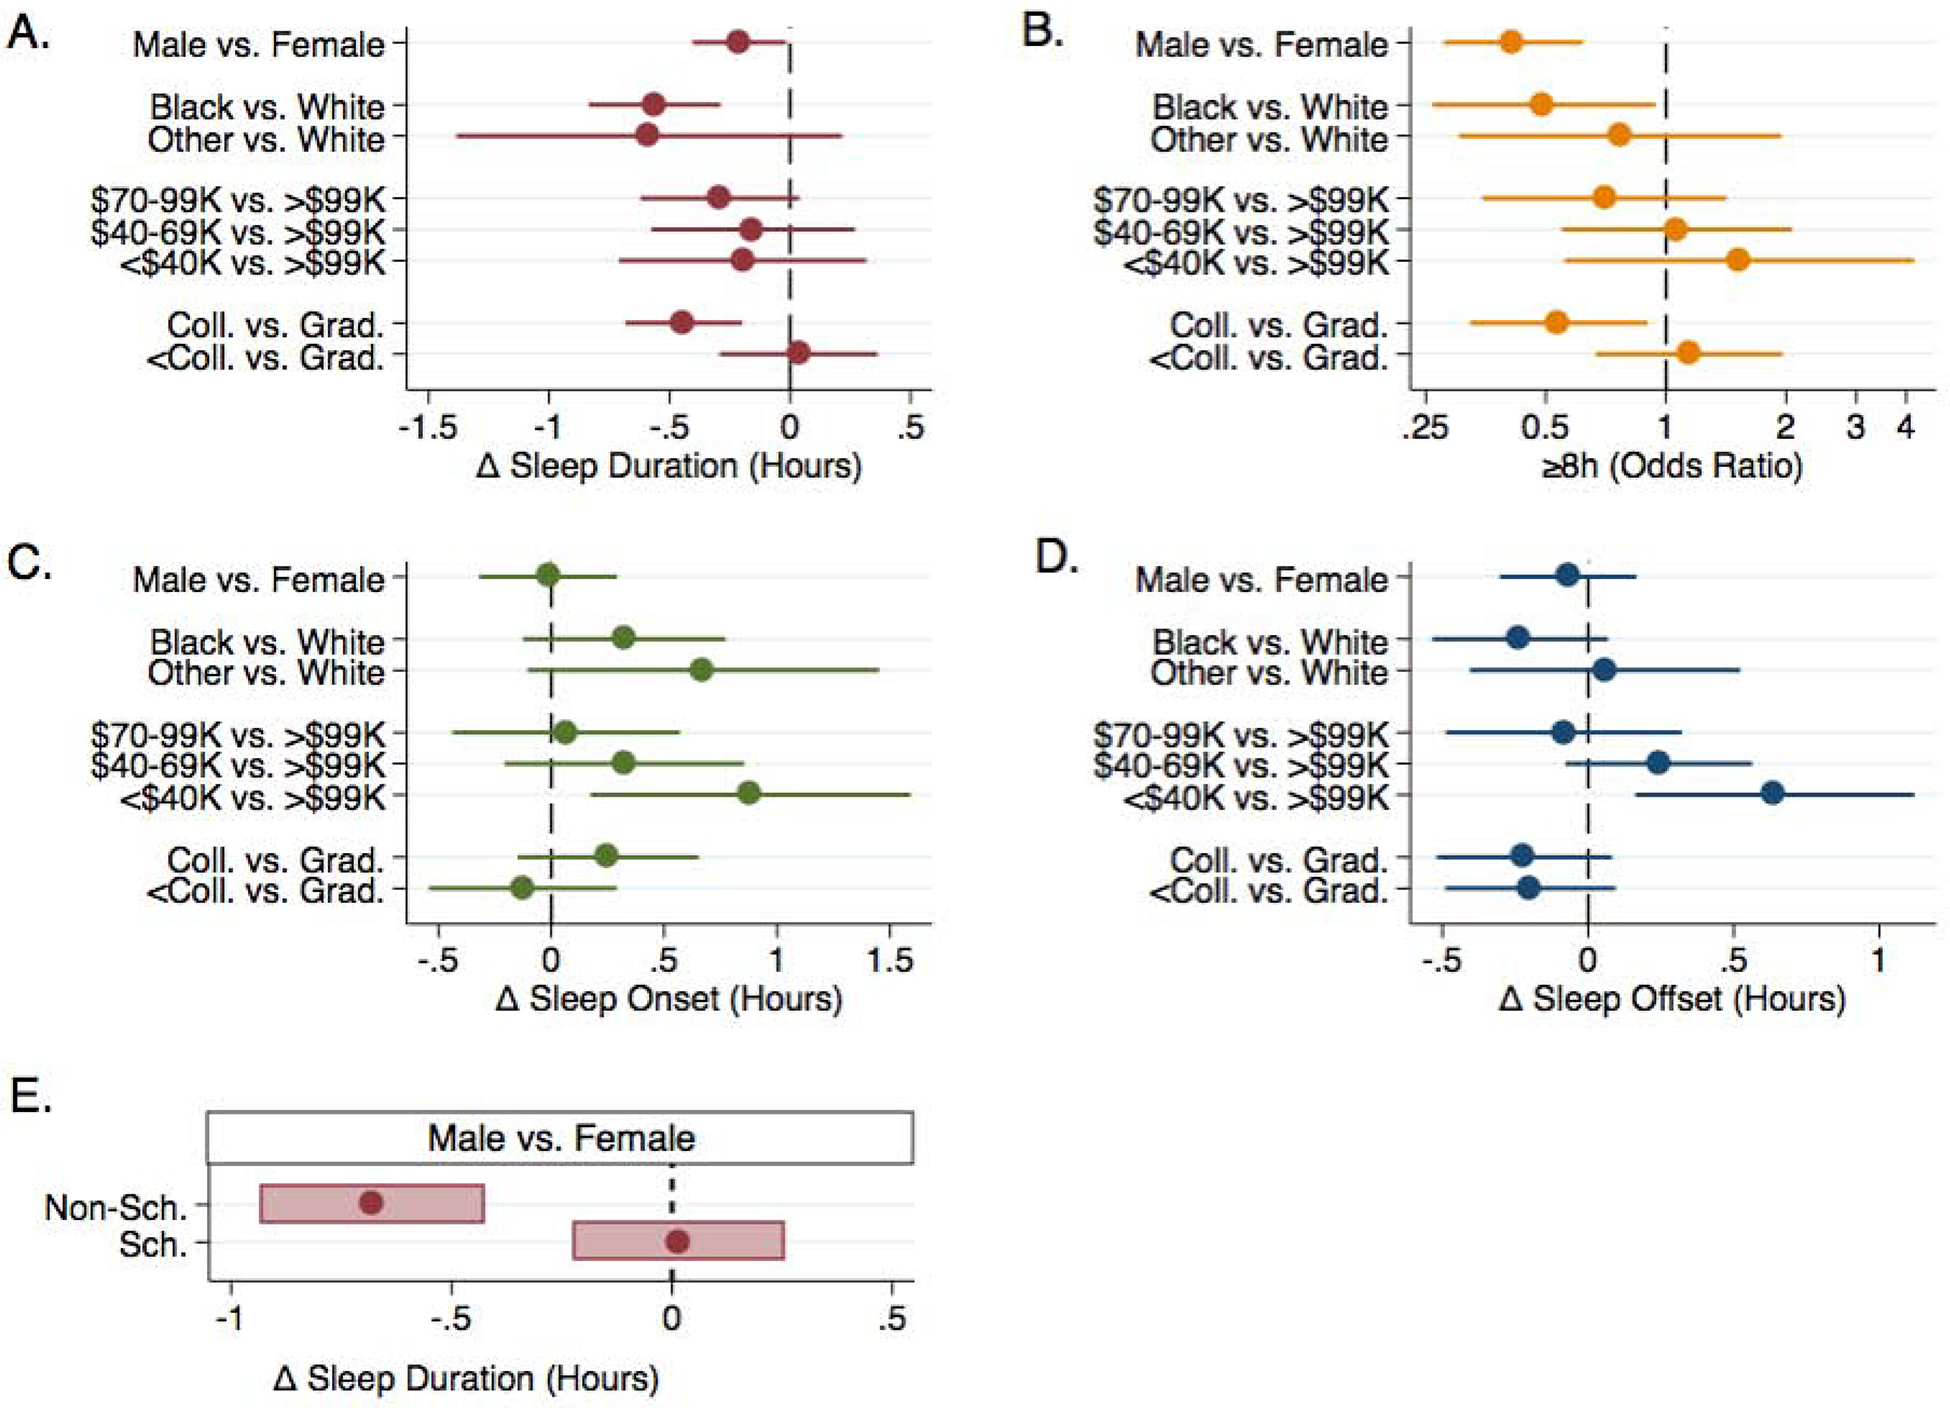
Figure 3.

Demographic factor associations with the sleep outcomes. Main associations are presented in panels A (sleep duration), B (sleep sufficiency), C (sleep onset) and D (sleep offset). Delta (Δ): difference from the referent group for each demographic factor. Sex specific sleep duration associations on school and non-school nights are in panel E (based on significant sex x school night status interaction). The log-scale is used to present the odds ratios in panel B.
