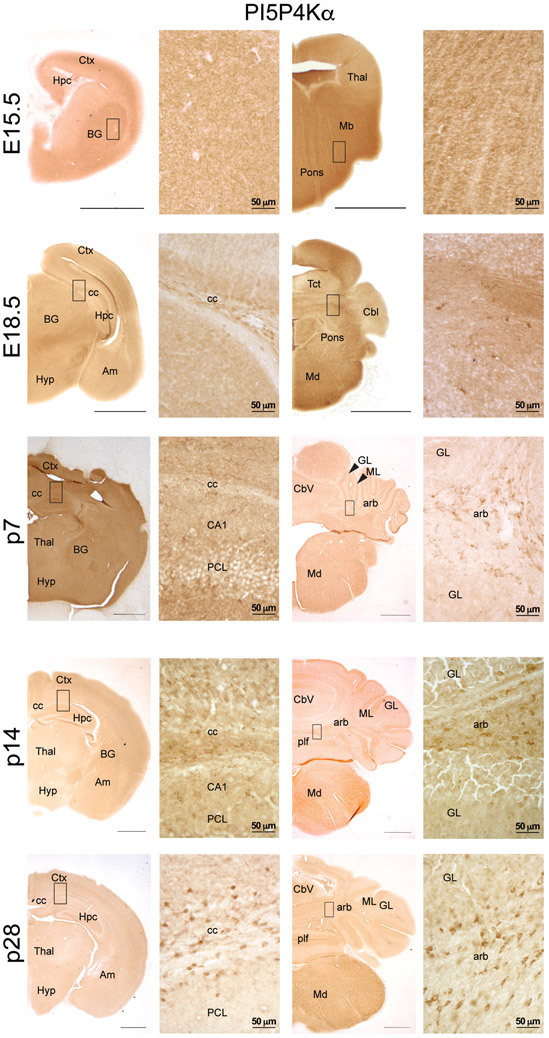
Figure 3.
Immunoperoxidase staining for PI5P4Kα (Abgent) at the indicated developmental timepoints. Scale bars for low-magnification images = 150 μm, scale bars for high-magnification images are indicated for each bar; Ctx, cortex; Hpc, hippocampus; BG, basal ganglia; Thal, thalamus; Mb, midbrain; Hyp, hypothalamus; Am, amygdala; Tct, tectum; Cbl, cerebellum; Md, medulla; CC, corpus callosum; PCL, pyramidal cell layer; Cbv, cerebellar vermis; GL, granule cell layer of the cerebellum; ML, molecular cell layer of the cerebellum; plf, posterolateral fissure; arb, arbor vitae; arrowheads identify relevant named structures

