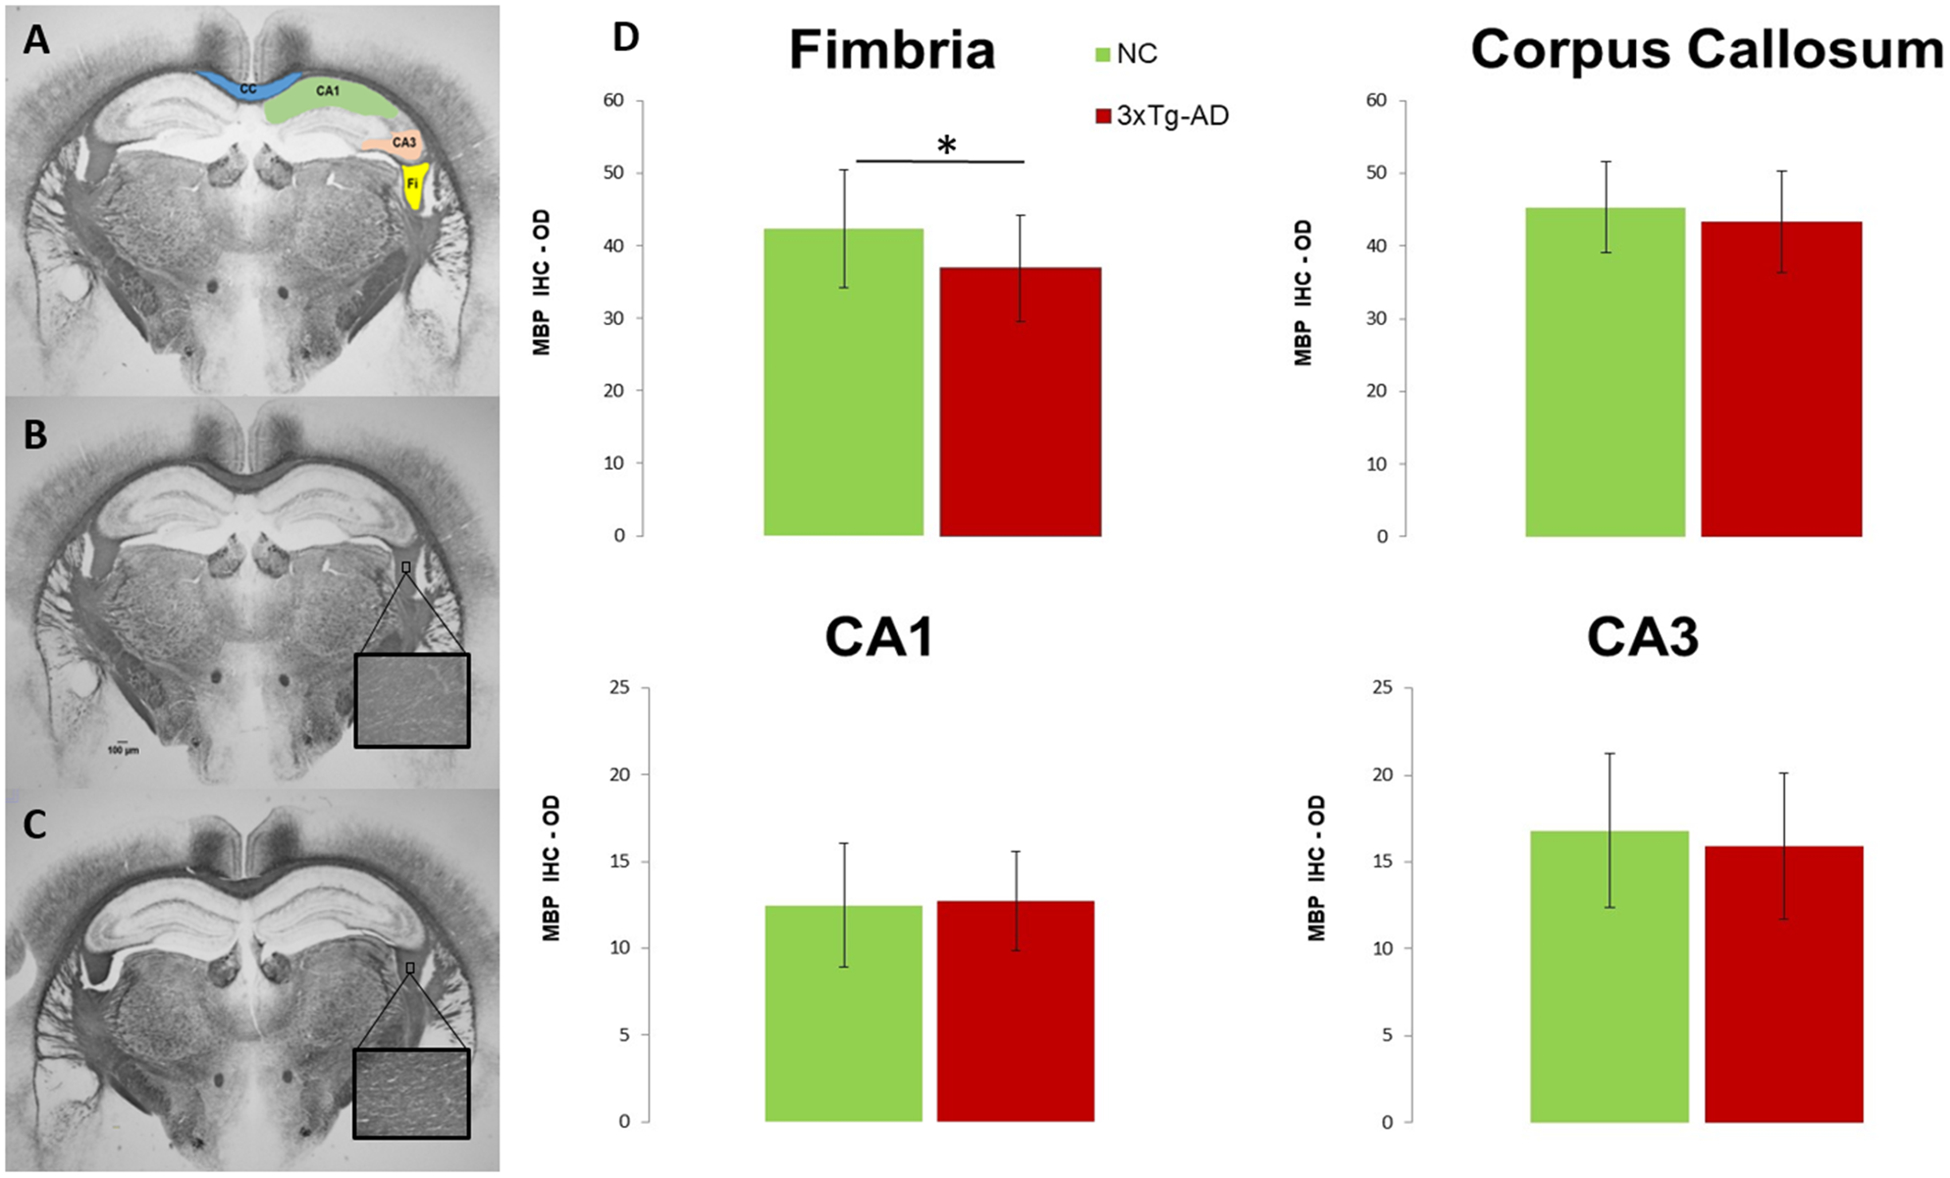
Figure 3:

(A) Representative of the myelin basic protein (MBP) stain (1.25x magnification) with ROIs highlighted for corpus callosum (CC), fimbria (Fi), and dorsal hippocampus subfields CA1 and CA3. Scale bar = 100μm. MBP stain for (B) 3xTg-AD and (C) NC mice (inserts 40x magnification). (D) Quantitative analysis of the MBP immunoreactivity; values are expressed as optical density (OD) = log (max intensity/mean intensity), where max intensity = 255 for the 8-bit images. * p≤ 0.05.
