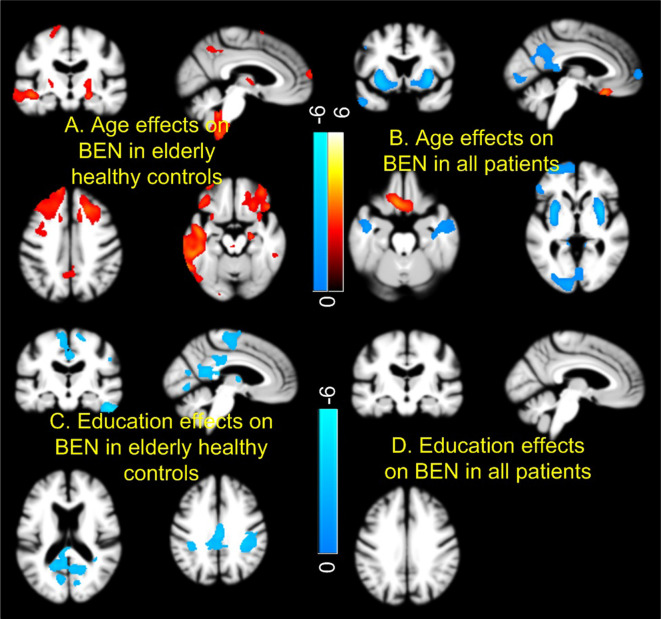
Figure 3.
Age and education effects of brain entropy (BEN). Controls and patients [mild cognitive impairment (MCI) and AD] showed opposite BEN vs. age relationship in most part of the brain (A,B). Education years correlated with reduced BEN in default mode network in controls (C), but not in patients (D). Red and cool colors mean positive and negative correlations, respectively. Color bars indicate the display windows of the t-maps of the regression analysis.

