Figure 2.

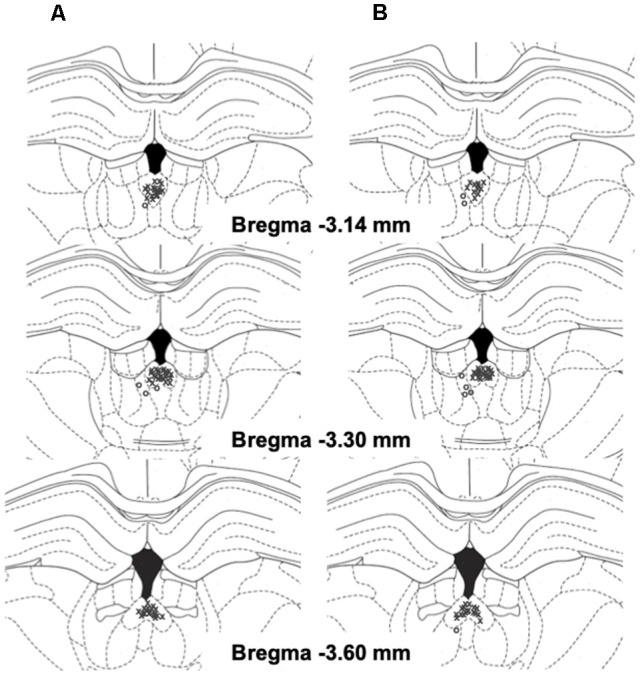
Schematic representation of injection sites in the pPVT (x, rats with correct injection sites; o, rats with missed injection sites) in EtOH (A) and SCM (B) rats.

Schematic representation of injection sites in the pPVT (x, rats with correct injection sites; o, rats with missed injection sites) in EtOH (A) and SCM (B) rats.