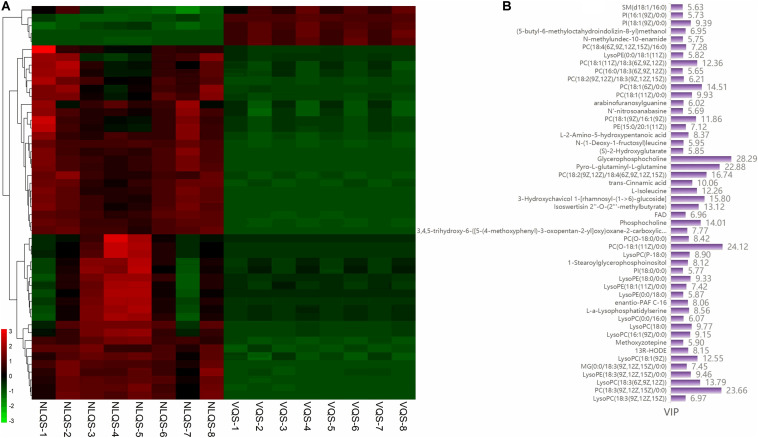
FIGURE 4.
Heat map of the hierarchical clustering analysis of the top 50 differentially expressed metabolites in the comparison of NLQS with VQS in the honeybee Apis mellifera. (A) Differentially expressed metabolites were separated using hierarchical clustering. The x-axis has the eight (1–8) biological replicates of each type of spermatheca, and the y-axis represents the differentially expressed metabolites separated using hierarchical clustering. The color from green to red indicates an increase in abundance of metabolites from low to high, respectively. (B) VIP values of each differentially expressed metabolite.

