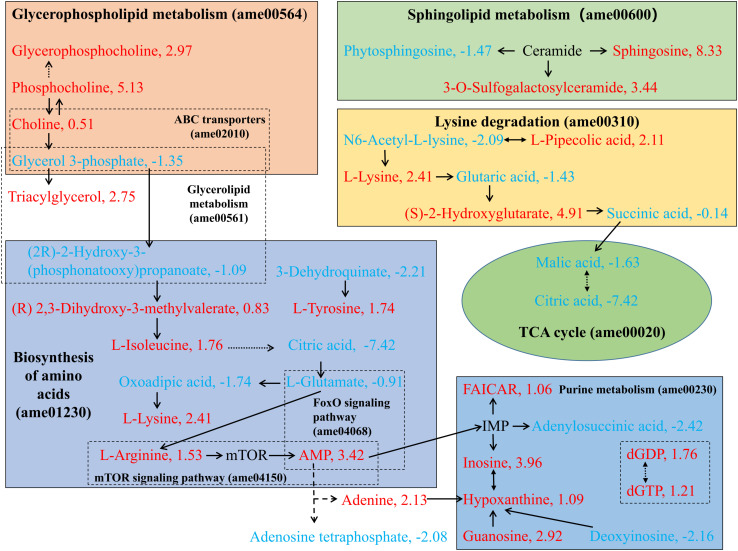
FIGURE 8.
Summary of the primary metabolic pathways that changed in the comparison of NLQS with VQS in the honeybee Apis mellifera. The pathways were summarized and outlined based on the KEGG database (see footnote). The profiles of differentially expressed metabolites were obtained from the LC–MS of metabolomic data. The text color indicates the level of change in the NLQS compared with that in the VQS: a red, positive number indicates a higher level; a blue, negative number indicates a lower level. Solid arrows indicate direct action; dashed arrows indicate a remote-action relationship; and double-sided arrows indicate interaction.

