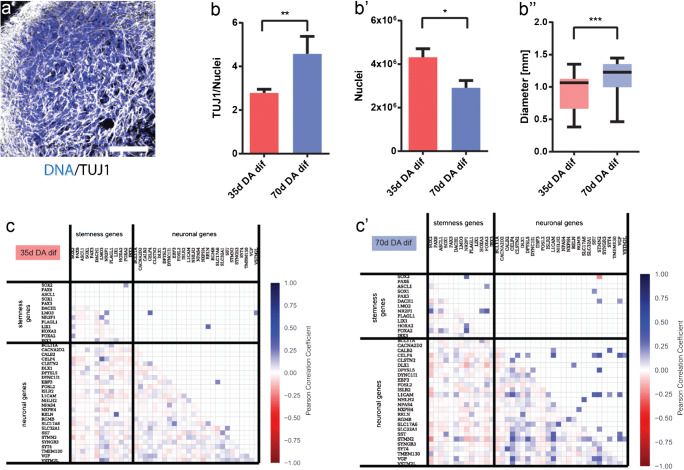
Fig. 1.
Identification of neuronal population in midbrain-specific organoids. (a) Immunohistological staining of TUJ1 expressing neurons in 35-day organoid sections (50-μm thickness, scale bar 100 μm). (b) The ratio of TUJ1 positive pixels normalized against Hoechst (35 days n = 59, 70 days n = 48). (b’) Quantification of Hoechst positive pixel (35 days n = 22, 70 days n = 29). (b”) Average size of four different organoid lines. Whiskers present minimum and maximum (35 days n = 21, 70 days n = 44). Data presented as mean ± SEM. (c) Gene-gene correlation matrices, for genes at day 35 (c), and day 70 (c’)

