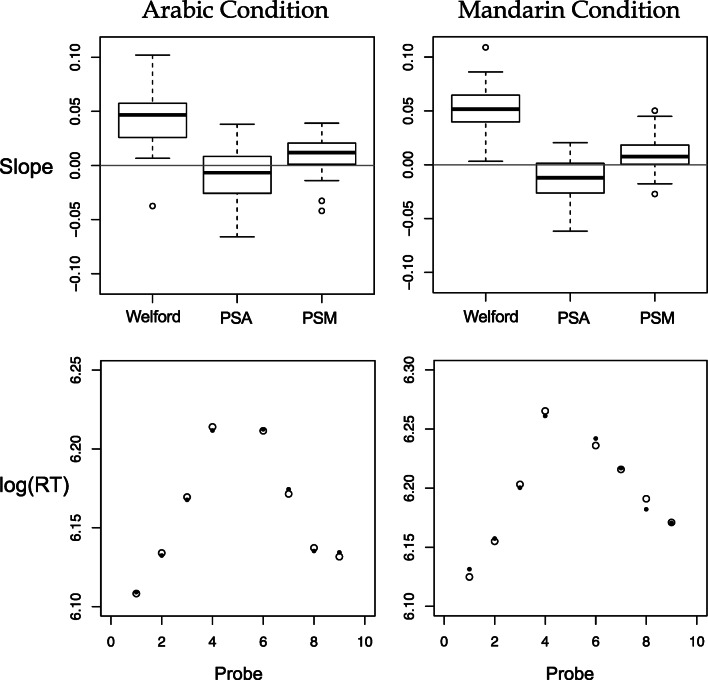
Fig. 2.
Summaries of the model fits. The top row shows boxplots displaying the distribution of slopes (i.e., the β values associated with each predictor) for participant for each predictor variable in the Arabic and Mandarin conditions, respectively, left and right figures. The bottom row shows a summary of the fits of the model. Specifically, the white circles are the reaction time (RT) data collapsed over participant, and the black circles are the fit data from the model, collapsed over participant in the Arabic and Mandarin conditions, respectively left and right figures

