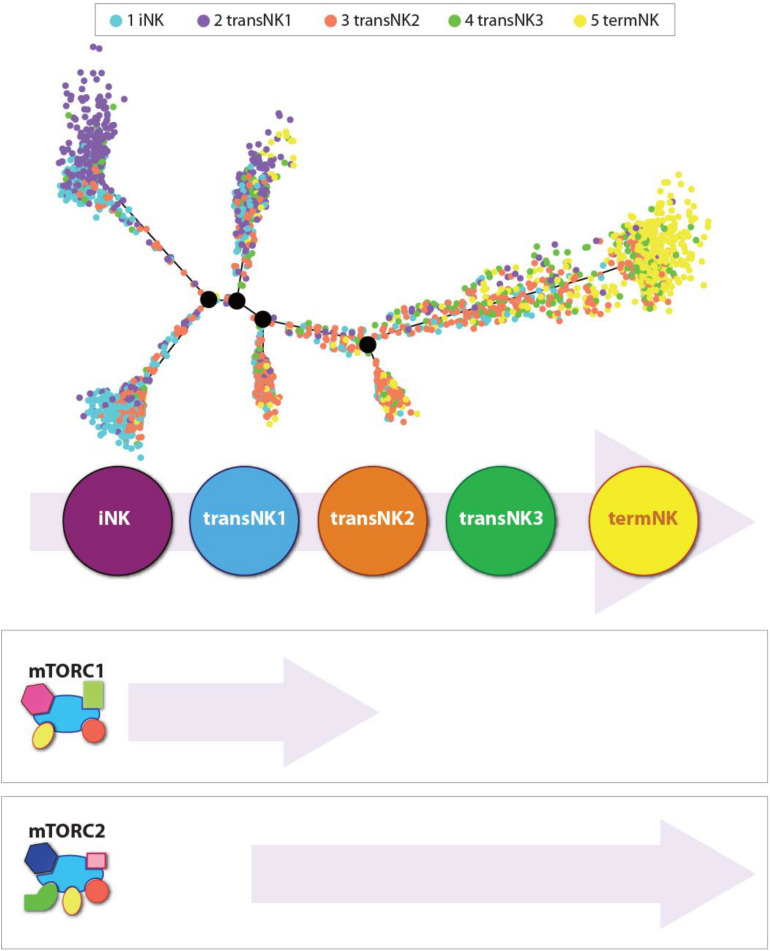
FIGURE 3.
Independent roles of mTORC1 and mTORC2 during the development of NK cells. Distribution of all five NK clusters along the pseudotime trajectory from the bone marrow of wild-type C57BL/6 mice. The relative maturity of the developmental trajectory is displayed across pseudotime. Distribution of each NK clusters along the pseudotime trajectory. Data presented are adapted from Yang et al., 2020.

