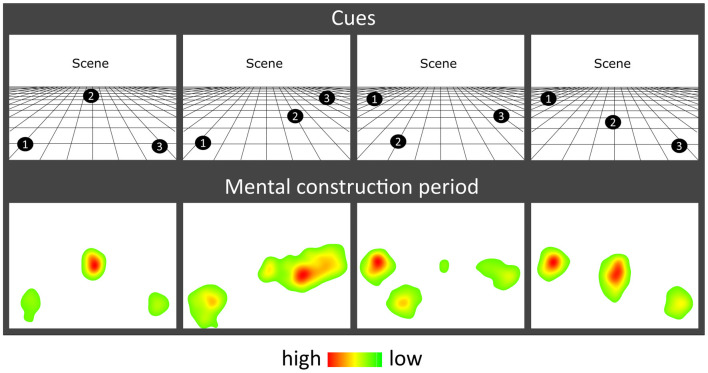
Figure 2.
Eye movement results. Heat maps of the fixation count during the 9 s mental construction period following each cue configuration. Each heat map is an aggregate of fixations on the blank screen across all trials for that cue configuration across all participants with eye-tracking data (n = 19). Red indicates higher fixation density and green lower fixation density.

