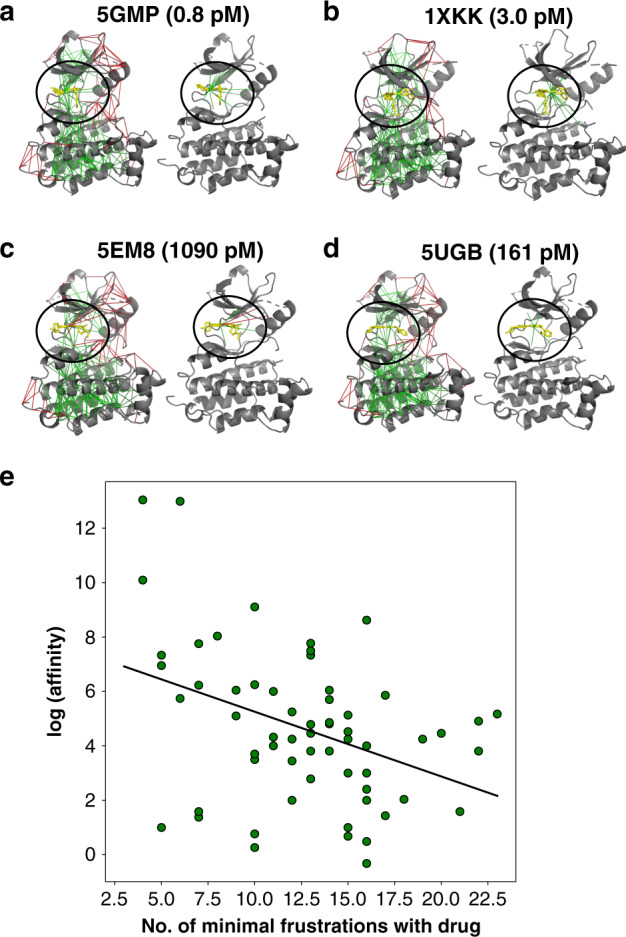
Fig. 5. Examples of localized frustration patterns in EGFR-inhibitor complexes.

For each binding complex in (a–d), the frustration indices are shown as calculated and shown on the left panel, and frustrations around the ligands only are shown on the right panel. e The correlation between the number of minimally frustrated interactions in each EGFR-inhibitor complex and the logarithm of binding affinity in the picomolar unit at a base of 2 is shown. A regression line is plotted to illustrated the trends with a modest pearson correlation of 0.45.
