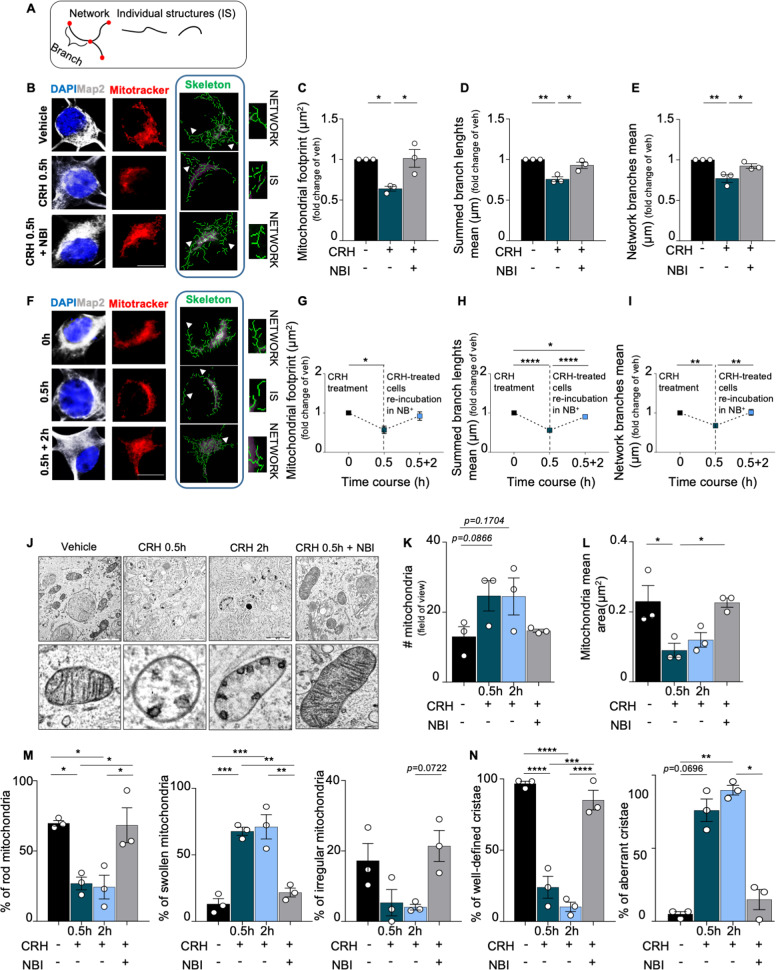
Fig. 3. CRH controls mitochondrial cristae remodeling, swelling and network complexity in primary hippocampal neurons.
A Schematic representation of mitochondrial structures: mitochondrial network (composed by two or more branches) and unbranched individual structures (IS). B Representative images of somatic mitochondrial network complexity, IHC for MAP2 (gray), mitochondria labeled with MitoTrackerTM (red), mitochondrial skeletonized structures (green) obtained with MiNa toolset39 (white arrowheads indicates examples of networks and IS) (scale bar = 5 μm) for all different experimental conditions (vehicle, CRH 100 nM 0.5 h and CRH 0.5 h + CRHR1 Blocker NBI30775 100 nM) and relative analysis: C mitochondrial footprint (μm), D summed branch lengths mean (μm) and E network branches mean (μm). F Cells were treated with CRH 100 nM for 0.5 h followed by Neurobasal Medium plus B27 for 2 h and 5 h. IHC for MAP2 (gray), mitochondria labeled with MitoTrackerTM (red), mitochondrial skeleton generated by Mitochondrial Network Analysis (MiNa) toolset (green)39 (white arrowheads indicates examples of networks and IS) (scale bar = 5 μm) and G–I relative time-course analysis of the same parameters described above. Somatic mitochondrial networks were analyzed in six neurons for each condition for each different independent preparation. J Representative electron microscopy (EM) images of somatic hippocampal mitochondria for all different experimental conditions (vehicle, CRH 100 nM 0.5 h and 2 h; CRH 0.5 h + CRHR1 Blocker NBI30775 100 nM) (scale bar = 1 μm). TEM images showing mitochondrial cristae remodeling in treated neurons. All the mitochondria per field of view were considered. K Quantification of number (#) of mitochondria and L mitochondrial mean area/12.77 μm2 (μm2). M Percentage of rod, swollen and irregular mitochondria. N Percentage of well-defined cristae and aberrant cristae. Experiments were performed in = 3 independent replicates at DIV14. Data are displayed as Mean ± SEM; one-way ANOVA and Bonferroni’s post hoc comparison test were performed; data non normally distributed were analyzed by Kruskal–Wallis non parametric test followed by Uncorrected Dunn’s multiple comparison test. (*p < 0.05, **p < 0.005, ***p < 0.0005, ****p < 0.0001).

