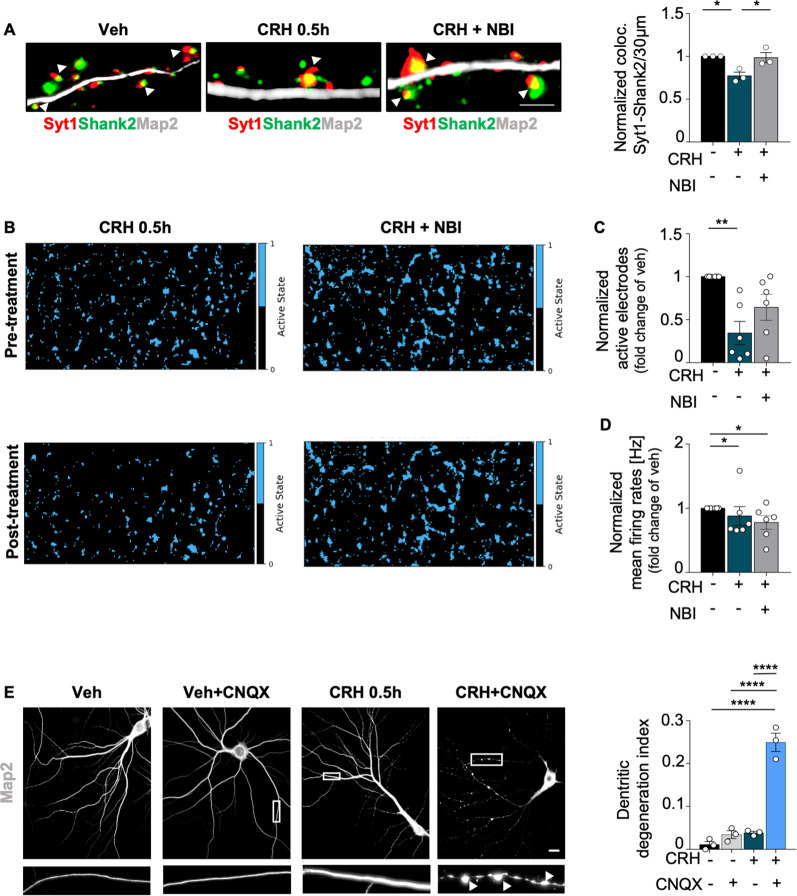
Fig. 5. Neuronal activity is reduced upon CRH treatment.
A IHC for MAP2 (gray), Shank2 (green) and Syt1 (red) in primary neurons treated with CRH 100 nM for 0.5 h and with CRH 0.5 h + CRHR1 Blocker NBI30775 100 nM and relative quantification of Syt1/Shank2 colocalization puncta; B representative images of Activity Scan Assay performed with MEA of the same cells before and after different treatments (CRH 100 nM for 0.5 h and with CRH 0.5 h + CRHR1 Blocker NBI30775 100 nM) and relative analysis of C active electrodes and D firing rates; E IHC for MAP2 (gray) in primary neurons after different experimental conditions using CNQX disodium salt (10 μM) (scale bar = 30 μm): vehicle, vehicle+CNQX, CRH 0.5 h, CRH 0.5 h + CNQX and relative quantification of the dendritic degeneration index. For the dendritic degeneration analysis, three different dendrites of three different neurons acquired from three different wells were analyzed for each condition in each independent experiment. All experiments were performed at DIV14. Synaptotagmin assay and dendritic degeneration experiments were performed in N = 3 independent replicates; MEA’s data were obtained from six wells for each treatment condition derived from two independent replicates. Data are displayed as Mean ± SEM; one-way ANOVA and Bonferroni’s post hoc comparison test were performed. Data non normally distributed were analyzed by Kruskal–Wallis non parametric test followed by Uncorrected Dunn’s multiple comparison test. (*p < 0.05, **p < 0.005, ***p < 0.0005, ****p < 0.0001).

