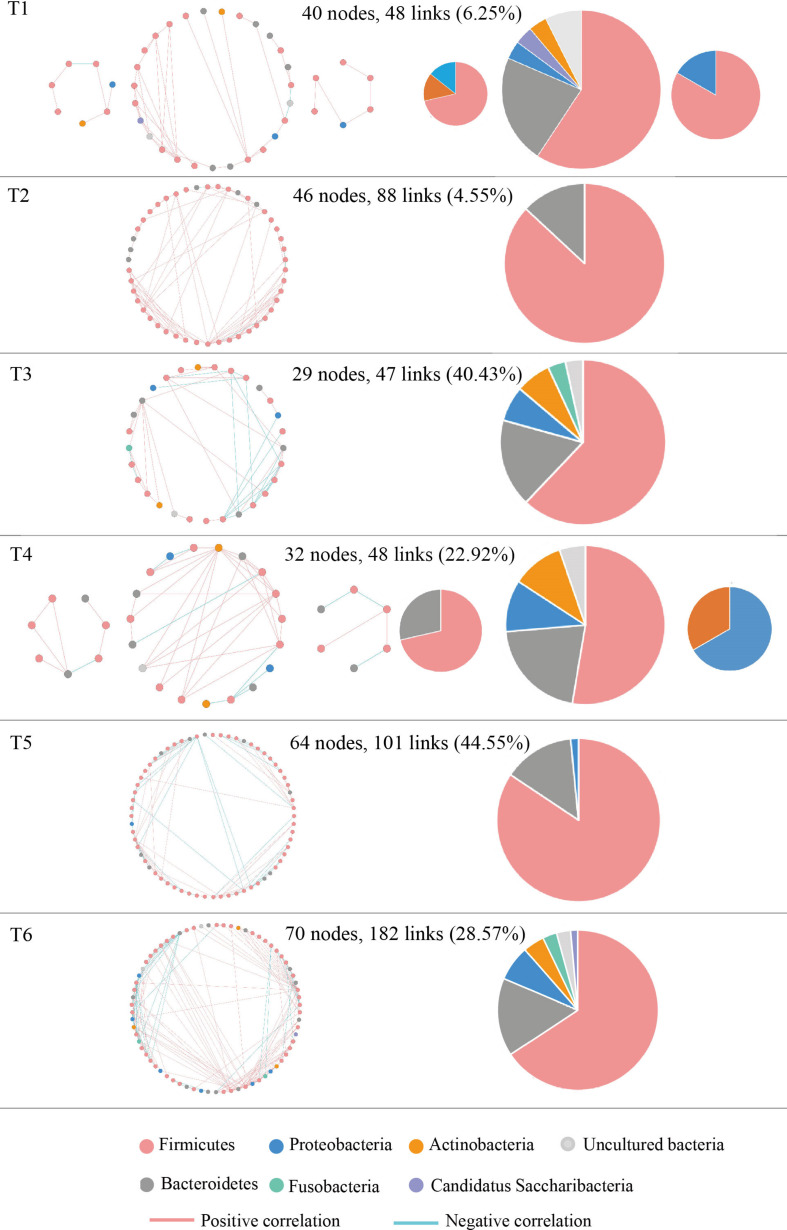
FIGURE 5.
Highly connected modules with intestinal microbial networks of NSCLC patients in response to osimertinib therapy. Node colors represent different phyla; pie charts represent the composition of the modules. A blue link indicates a negative relationship between two phyla, whereas a pink indicates a positive relationship. The number in bracket means the ratio of negative links accounting for the total links.

