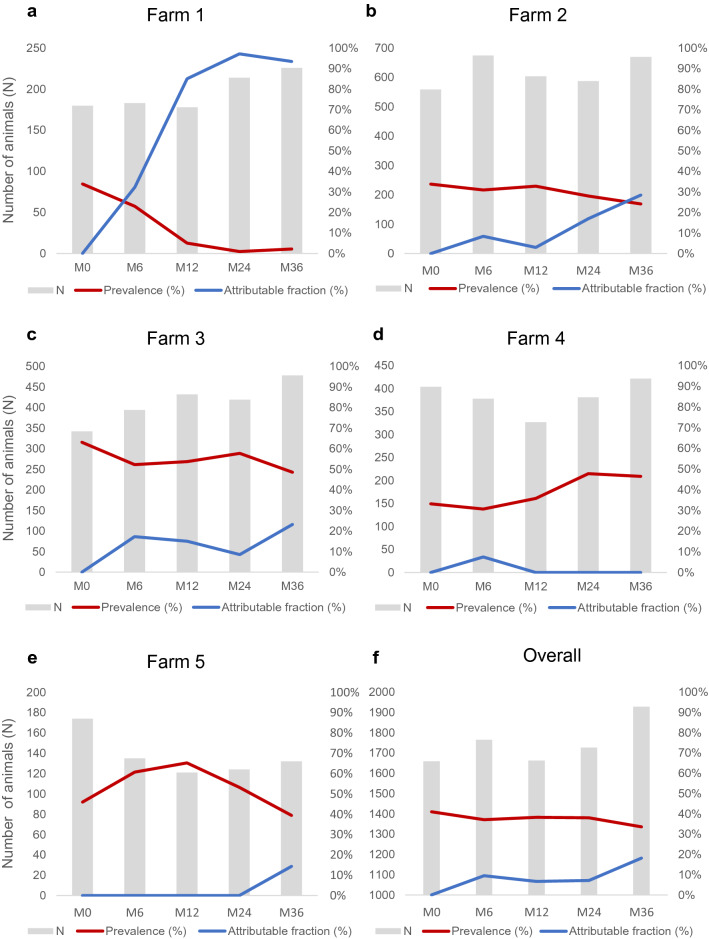
Figure 1.
Evolution of prevalence throughout the BCG vaccination trial. Evolution of census (grey bars), prevalence (red lines) and percentage of prevalence reduction (blue lines) in farms 1 (a), 2 (b), 3 (c), 4 (d) and 5 (e), and overall reduction of five farms (f). The prevalence was measured as the percentage (%) of TB positive animals = number of TB positive goats / total census. The reduction of prevalence was measured as attributable fraction (AF) = (% of TB positive at M0—% of TB positive at M6 or M12 or M24 or M36) / % of TB positive at M0.

