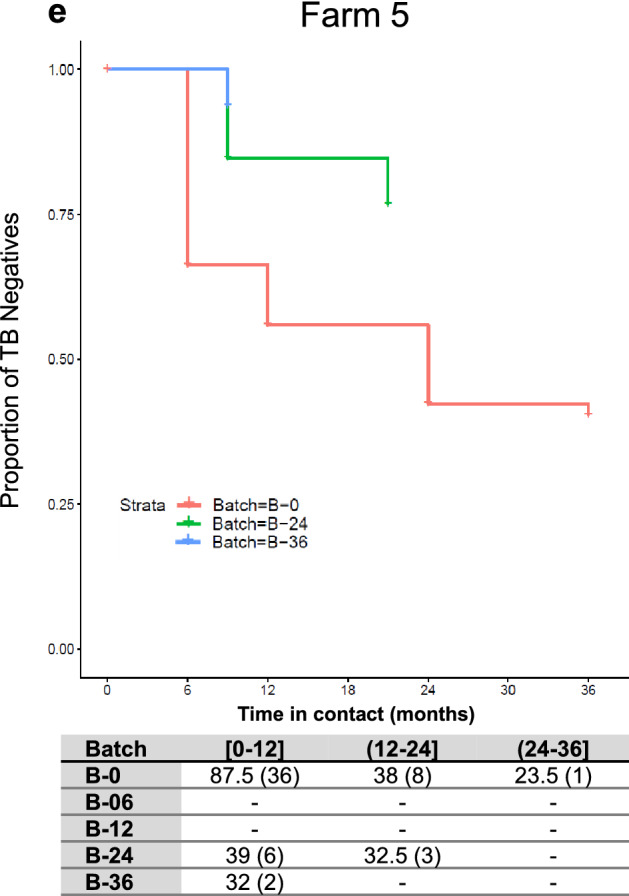
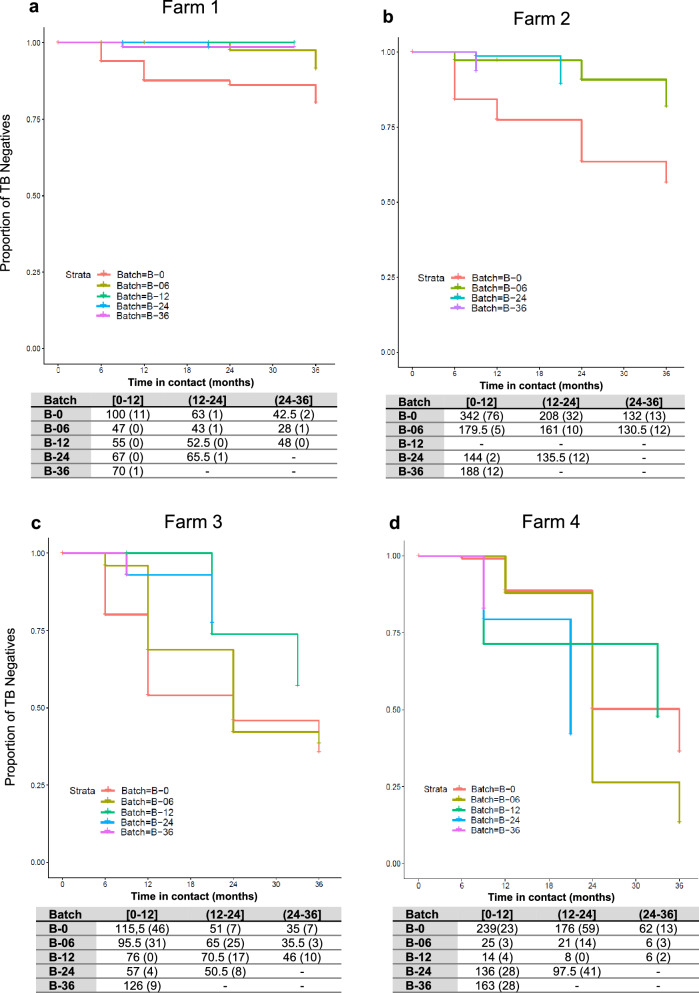
Figure 3.

TB Incidence in BCG vaccinated batches from farms 1 (a), 2 (b), 3 (c), 4 (d) and 5 (e) throughout the trial. Proportion of TB negative animals (y axis) throughout the time in contact (x axis) with the TB positive herd in months. The table represents the incidence of TB in each batch (B) depending on the time in contact, between 0 and 12 months ([0–12]), more than 12–24 months ((12–24]) and more than 24–36 months ((24–36]). The animals at risk, which were the TB negative animals between sampling time points (some animals were slaughtered or died between periods. Those animals were considered present during the half of the period and its number was divided by two). In parenthesis are represented the number of TB new positive goats during a given period.

