Figure 4.
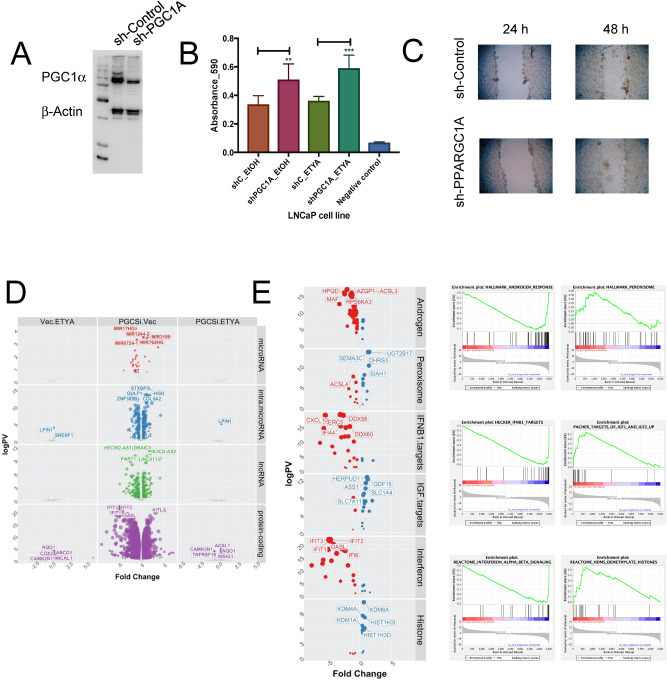
Stable knockdown of PGC1α in LNCaP cells changes proliferation and gene expression patterns. (A) LNCaP cells were each stably transfected with two shRNA constructs (sh-PGC1A 34 and 35) targeting PPARGC1A resulting in reduced PGC1α expression (sh-PGC1A) compared to empty vector (sh-CTRL) at protein level as detected in western blotting. (B) Measurements of cellular levels of ATP, as an indicator of cell viability was detected in the vector controls and knockdown cells. Each measurement was performed in biological triplicates and in triplicate wells. Cells were treated in triplicate with exogenous PPARγ ligand ETYA (10 µM, 96 hr) or EtOH vehicle control. Increased cell proliferation was seen in sh_PGC1A cells after treatment with ETYA at 96 h. (C) Time course scratch closure of sh-Control and sh-PPARGC1A cells mechanically wounded with p200 sterile pipette tip, sh-PPARGC1A after 48 h showed increased cell migration compared to sh-Control. (D) LNCaP sh-PGC1A and sh-CTRL cells were treated with ETYA (10 µM, 24 h) or EtOH vehicle control and total RNA expression and RNA-Seq undertaken according to the edgeR pipeline. Volcano plots depicting expression changes upon PGC1α knockdown or in response ETYA in the indicated classes of RNA in color (− log10(p.adj) > 1, abs (log2(fold change))). (E) Summary of significantly enriched pathways from gene set enrichment analyses (GSEA) (FDR q.val < 0.05) associated with reducing PGC1α expression levels.

