Figure 1.
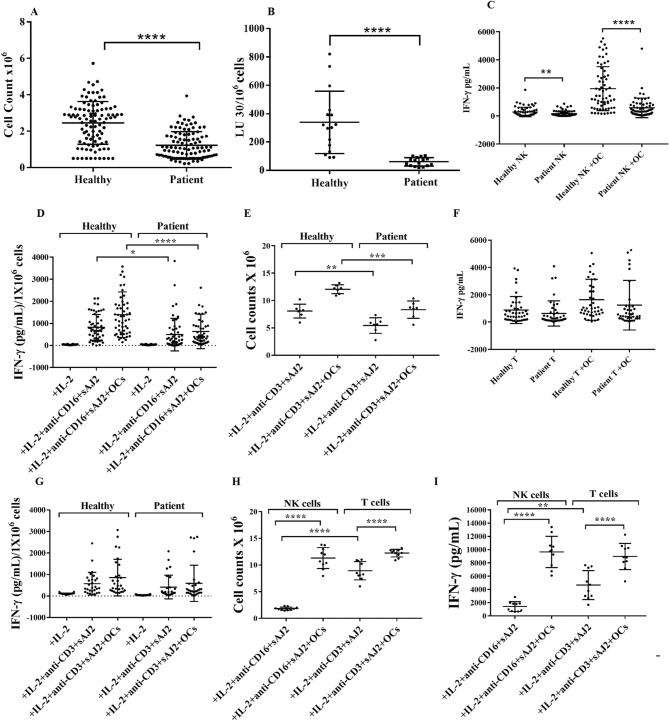
OC-expanded NK cells from cancer patients have much lower capacity to expand, mediate cytotoxicity, and secrete IFN-γ. OCs were generated as described in Materials and Methods. NK cells (1 × 10⁶ cells/ml) from healthy individuals and cancer patients were treated with a combination of IL-2 (1000 U/ml) and anti-CD16mAb (3 µg/ml) for 18 h before they were cultured with the healthy individuals’ OCs and sAJ2 at a ratio of 1:2:4 (OCs:NK:sAJ2). On days 6, 9, 12, and 15 of co-culture, the numbers of lymphocytes were counted using microscopy (n = 70) (A). NK cells were treated and cultured as described in Fig. 1A. Cytotoxicity of day 15 cultured NK cells was determined using standard 4-h 51Cr release assay against OSCSCs. The Lytic units (LU) 30/106 cells were determined using the inverse number of NK cells required to lyse 30% of OSCSCs × 100 (n = 16) (B). NK cells were treated and cultured as described in Fig. 1A. On days 6, 9, 12, and 15, supernatants were harvested from the co-cultures to determine IFN-γ secretion using single ELISA (n = 63) (C). The amounts of IFN-γ secretion shown in Fig. 1C were determined based on 1 × 10⁶ cells (n = 63) (D). T cells (1 × 10⁶ cells/ml) from healthy individuals and cancer patients were treated with a combination of IL-2 (100 U/ml) and anti-CD3 (1 µg/ml)/CD28mAb (3 µg/ml) for 18 h before they were co-cultured with healthy individuals’ OCs and sAJ2 at a ratio of 1:2:4 (OCs:T:sAJ2). On days 6, 9, 12, and 15, the T cells were counted using microscopy; the cumulative cell counts from day 0 to day 15 are displayed in the figure (n = 7) (E). T cells were treated and cultured as described in Fig. 1E. The supernatants were harvested on days 6, 9, 12, and 15, and the levels of IFN-γ secretion were determined using single ELISA (n = 42) (F). Amounts of IFN-γ secretion shown in Fig. 1F were assessed based on 1 × 10⁶ cells (n = 42) (G). NK cells and T cells were treated and cultured as described in Fig. 1A and Fig. 1E respectively. The cells were counted using microscopy on days 6, 9, 12, and 15; the cumulative cell counts from day 0 to day 15 are displayed in the figure (n = 10) (H). NK and T cells were treated and cultured as described in Fig. 1A and Fig. 1E respectively. The supernatants were then harvested on days 6, 9, 12, and 15 of the co-cultures and the amounts of IFN-γ secretion were determined using single ELISA; the cumulative levels of IFN-γ secretion from day 0 to day 15 are displayed in the figure (n = 10) (I).

