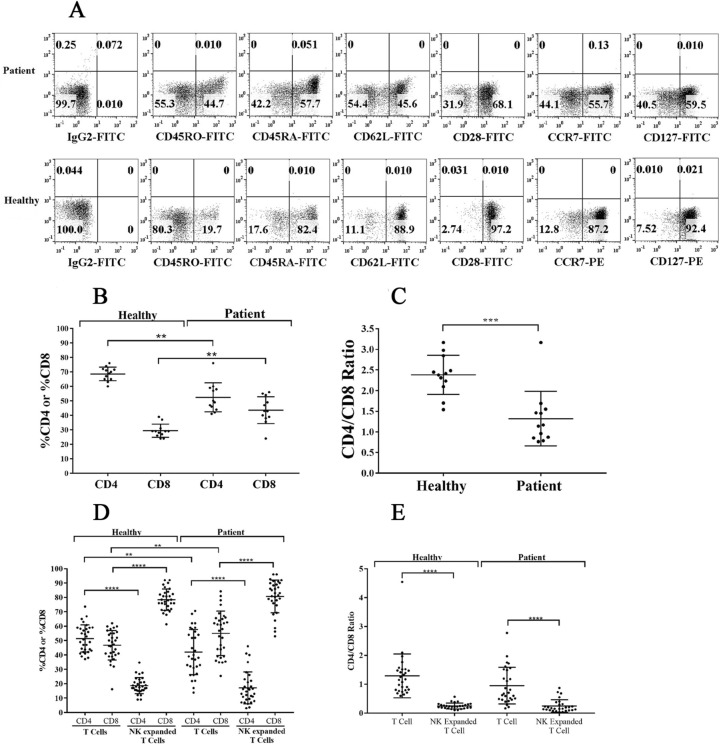
Figure 3.
T cells from cancer patients exhibit lower CD4 + /CD8 + T cell ratio both in peripheral blood and after expansion. T cells purified from PBMCs of healthy individuals and cancer patients were analyzed for the surface expression of CD45RO, CD45RA, CD62L, CD28, CCR7, and CD127 using flow cytometry. IgG isotype control was used to assess non-specific binding. One of 12 representative experiments is shown in the figure (A). PBMCs isolated from the peripheral blood of healthy individuals and cancer patients were used to determine the surface expression of CD4 and CD8 using flow cytometry, and the percentages of CD4 + and CD8 + T cells were determined within CD3 + populations (n = 12) (B). The ratio of CD4:CD8 is shown in the figure (n = 12) (C). NK and T cells of healthy individuals and cancer patients were treated and co-cultured as described in Fig. 1A and Fig. 1E respectively. On days 6, 9, 12, and 15 of co-culture, the surface expression of CD4 and CD8 were analyzed by flow cytometry to obtain the percentages of CD4 + and CD8 + T cells within CD3 + populations (n = 28) (D). The ratio of CD4:CD8 is shown in the figure (n = 28) (E).

