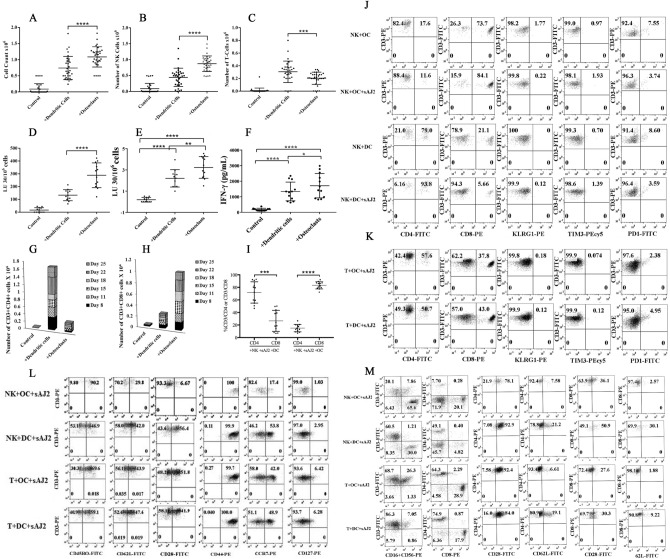
Figure 4.
OC-expanded NK cells induced CD8 + T cell expansion whereas DC-expanded NK cells promote CD4 + T cell expansion. OCs and DCs were generated as described in Materials and Methods. NK cells from healthy individuals (1 × 10⁶ cells/ml) were treated with a combination of IL-2 (1000 U/ml) and anti-CD16mAb (3 µg/ml) for 18 h before they were co-cultured with autologous DCs or OCs in the presence of sAJ2 at 1:2:4 ratios (DCs or OCs:NK:sAJ2). The expanding cells were counted on days 8, 11, 15, and 18 using microscopy (n = 30) (A). NK cells were co-cultured with OCs or DCs as described in Fig. 4A, and the surface expressions of CD3, CD16, and CD56 were analyzed on days 8, 11, 15, and 18 using flow cytometry. The numbers of NK cells and T cells were determined using the percentages of CD16 + and CD3 + cells, respectively, within the total cells in Fig. 4A (n = 30) (B, C). NK cells were co-cultured with OCs or DCs as described in Fig. 4A and cytotoxicity of day 15 expanded cells was determined using a standard 4-h 51Cr release assay against OSCSCs. LU 30/106 cells were determined using the method described in Fig. 1B (n = 12) (D). NK cells were co-cultured with OCs or DCs as described in Fig. 4A, and the surface expressions of CD16 were analyzed on day 15 using flow cytometry. The levels of the cytotoxicity was determined based on 1% of CD16 + NK cells (n = 12) (E). NK cells were co-cultured with OCs or DCs as described in Fig. 4A; the supernatants were harvested on days 8, 11, 15, and 18 of the co-cultures, and the amounts of IFN-γ secretion were determined using single ELISA (n = 12) (F). NK cells were co-cultured with OCs or DCs as described in Fig. 4A. On days 8, 11, 15, 18, 22 and 25 of the co-cultures the surface expressions of CD3 + CD4 + and CD3 + CD8 + T cells were determined using flow cytometry, and the percentages were used to determine the total numbers of CD3 + CD4 + and CD3 + CD8 + cells within the total cells (n = 12) (G, H). NK cells were co-cultured with OCs or DCs as described in Fig. 4A, and the surface expressions of CD3, CD4, and CD8 were analyzed on days 8, 11, 15, and 18 using flow cytometry. Percentages of CD4 + and CD8 + T cells within the CD3 + populations are shown in this figure (n = 12) (I). NK cells were co-cultured with OCs or DCs as described in Fig. 4A and the surface expressions of CD4, CD8, KLRG1, TIM3, and PD-1 were analyzed within CD3 + cells on day 27 of the co-cultures using flow cytometry (n = 8) (J). T cells (1 × 10⁶ cells/ml) from healthy individuals were treated with a combination of IL-2 (100 U/ml) and anti-CD3 (1 µg/ml)/CD28mAb (3 µg/ml) for 18 h before they were co-cultured with autologous DCs or OCs in the presence of sAJ2 at 1:2:4 ratios (DCs or OCs:T:sAJ2). Surface expressions of CD4, CD8, KLRG1, TIM3, and PD-1 were analyzed within CD3 + cells on day 27 of the co-culture using flow cytometry (n = 8) (K). NK and T cells were co-cultured with OCs or DCs as described in Fig. 4A and Fig. 4 K, respectively. Surface expressions of CD45RO, CD62L, CD28, CD44, CCR7, and CD127 were analyzed within CD3 + cells on day 12 of the co-culture using flow cytometry (n = 8) (L). NK and T cells were co-cultured with OCs or DCs as described in Fig. 4A and Fig. 4 K, respectively and the surface expressions of CD3, CD16, CD56, CD4, CD8, CD28, and CD62L were analyzed on day 12 of the co-culture using flow cytometry (n = 8) (M).

