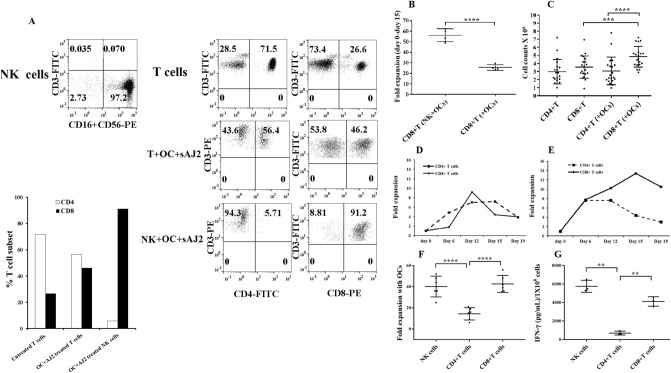
Figure 5.
OC-induced activation increases CD8 + T cells. NK cells and T cells were purified from healthy individuals’ PBMCs and the surface expressions of CD3, CD16, and CD56 on freshly isolated NK cells (left panel) and of CD3, CD4 and CD8 on freshly isolated T cells (upper right panel) were determined using flow cytometry. NK cells were treated and co-cultured with OCs and sAJ2 as described in Fig. 1A (middle right panel), and T cells were treated and co-cultured with OCs and sAJ2 as described in Fig. 1E (lower right panel). Surface expressions of CD3, CD4, and CD8 were analyzed on day 12 of the co-culture using flow cytometry (A). NK cells were treated and co-cultured with OCs and sAJ2 as described in Fig. 1A (left bar). Freshly purified CD8 + T cells (1 × 10⁶ cells/ml) from healthy individuals were treated with a combination of IL-2 (100 U/ml) and anti-CD3 (1 µg/ml)/CD28mAb (3 µg/ml) for 18 h before they were co-cultured with OCs and sAJ2 at 1:2:4 ratios (OCs:CD4T or CD8T:sAJ2) (right bar). On days 6, 9, 12 and 15 of the co-cultures, the surface expressions of CD3 + CD8 + T cells were determined using flow cytometry, and the percentages were used to determine the numbers of CD8 + T cells within the total cells. Fold expansion for each time point is shown in the figure (n = 4) (B). Freshly purified CD8 + T cells and CD4 + T cells (1 × 10⁶ cells/ml) from healthy individuals were treated with a combination of IL-2 (100 U/ml) and anti-CD3 (1 µg/ml)/CD28mAb (3 µg/ml) for 18 h before they were co-cultured with sAJ2 (T:sAJ2; 1:2) or with OCs and sAJ2 at 1:2:4 ratios (OCs:CD4T or CD8T:sAJ2). On days 6, 12, 15, and 19 of co-culture, the expanded cells were counted using microscopy (n = 20) (C). Purified CD8 + T cells and CD4 + T cells were treated and co-cultured with sAJ2 as described in Fig. 5C. On days 6, 12, 15 and 19 of co-culture, the expanded cells were counted using microscopy. Fold expansion for each time point is shown in the figure (D). Freshly purified CD8 + T cells and CD4 + T cells were treated and co-cultured with sAJ2 and OCs as described in Fig. 5C. On days 6, 12, 15 and 19 of co-culture, the expanded cells were counted using microscopy. Fold expansion for each time point is shown in the figure (E). NK cells were treated and co-cultured with OCs as described in Fig. 1A. CD8 + T cells and CD4 + T cells were treated as described in Fig. 5C. On days 6, 9, 12 and 15 of co-culture, the expanded cells were counted using microscopy. The numbers of OC-expanded NK, OC-expanded CD4 + T and OC-expanded CD8 + T cells were subtracted from the number of non-OC-expanded control cells and the fold expansions were determined by dividing the resulting value by the initial input cells (n = 6) (F). NK cells were treated and co-cultured with OCs as described in Fig. 1A. CD8 + T cells and CD4 + T cells were treated as described in Fig. 5C. The supernatants were harvested from the co-cultures on days 6, 9, 12, and 15 and the secretions of IFN-γ were determined using single ELISA, and the values were adjusted based on a million lymphocytes (n = 3) (G).

