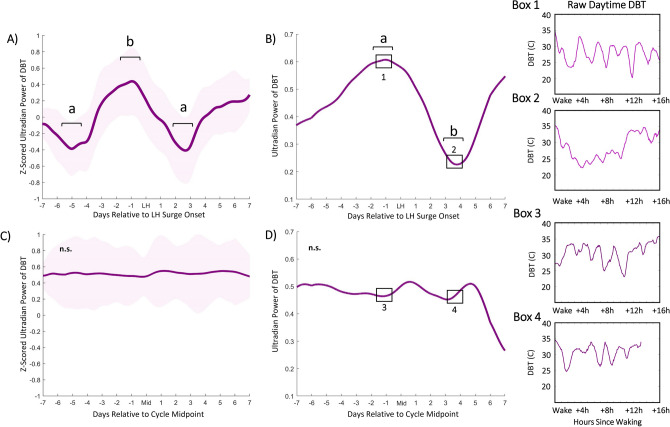
Figure 2.
Ultradian power of DBT anticipates LH surge onset. Mean DBT ultradian power (z-scored) ± standard deviation for premenopausal cycles (A) within one week of LH surge onset and perimenopausal cycles (C) within one week of mid cycle. DBT UR power peaks exhibit an inflection point 5.82 (± 1.82) days prior to LH onset, a peak a mean of 2.58 (± 1.89) before LH onset on average and a subsequent trough a mean of 2.6 (± 1.02) days after surge onset (χ2 = 5.66, p = 0.0174). Perimenopausal UR power shows no conserved peaks and troughs (χ2 = 0.37, p = 0.5354, for same comparisons). Representative individual example of raw DBT ultradian power within one week of LH surge onset in premenopausal (B) and within one week of mid cycle in perimenopausal (D) cycles. Black squares in (B) and (D) correspond to Boxes 1 & 2 and Boxes 3 & 4, respectively. Boxes show linear waking DBT from which ultradian power in B and D were generated; these days were selected to visually illustrate days of relatively high and low ultradian power in premenopausal cycles, and the same two days in perimenopausal cycles.

