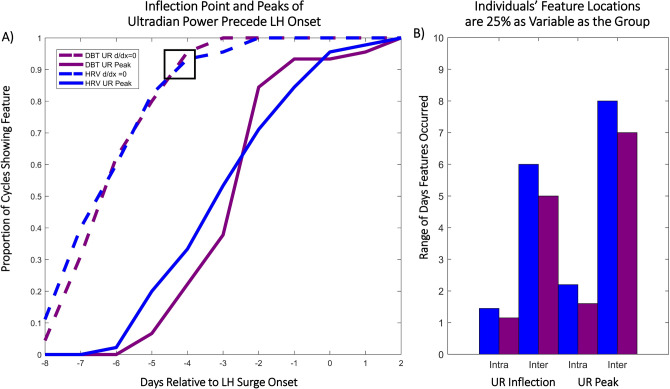
Figure 4.
Inflection Points and Peaks of Ultradian Power Anticipate the LH Surge Within and Across Individuals. (A) Cumulative histogram indicates the proportion of cycles showing an inflection point on a given day relative to LH surge onset (blue = HRV (RMSSD), maroon = DBT, dashed = inflection point, solid = subsequent peak). Box indicates that on day LH—4, ~ 90% of individuals had shown the HRV and DBT first inflection point. (B) Intra-vs. inter-individual range of days over which inflection points (“UR Inflection”) and subsequent peaks (“UR Peak”) of ultradian DBT and HRV power occurred. The range intra-individual range (2–3 cycles per individual) is 25% the size of the inter-individual range (45 total cycles).

