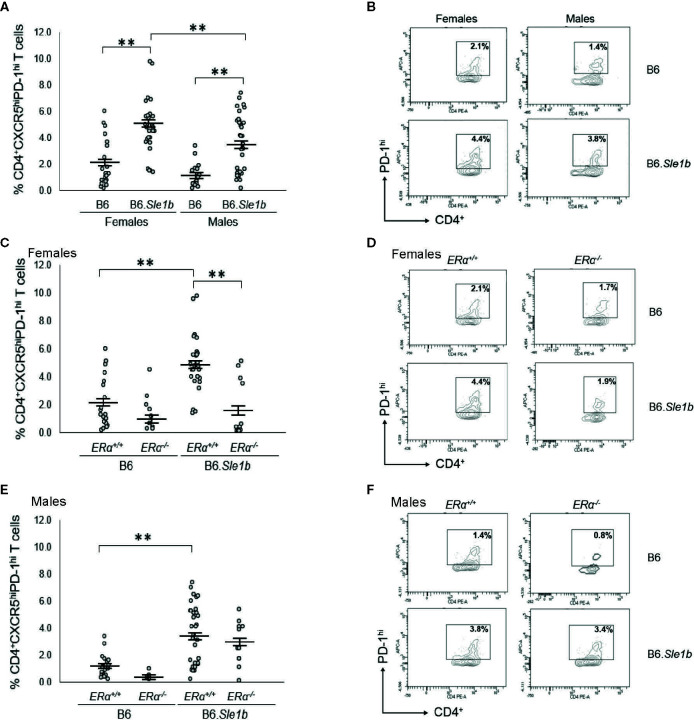
Figure 10.
Disruption of ERα abrogates Sle1b-induced Tfh cell hyperactivation in female mice. (A) Dot plots show the percentage of splenocytes in female B6 (N=23), female B6.Sle1b (N =30), male B6 (N=19), and male B6.Sle1b (N= 32) mice that were CD4+CXCR5hiPD-1hi follicular helper T (Tfh) cells. (B) Representative contour plots show the frequency of CD4+CXCR5hiPD-1hi Tfh cells in female and male B6 and B6.Sle1b mice. (C) Dot plots show the percentage of splenocytes in female B6.ERα+/+ (N=23), B6.ERα-/- (N=10), B6.Sle1b.ERα+/+ (N=30), and B6.Sle1b.ERα-/- (N=13) mice that were CD4+CXCR5hiPD-1hi Tfh cells. (D) Representative contour plots show the frequency of CD4+CXCR5hiPD-1hi Tfh cells in female B6.ERα+/+, B6.ERα-/-, B6.Sle1b.ERα+/+, and B6.Sle1b.ERα-/- mice. (E) Dot plots show the percentage of splenocytes in male B6.ERα+/+ (N=19), B6.ERα-/- (N=5), B6.Sle1b.ERα+/+(N=32), and B6.Sle1b.ERα-/- (N=11) mice that were CD4+CXCR5hiPD-1hi Tfh cells. (F) Representative contour plots show the frequency of CD4+CXCR5hiPD-1hi Tfh cells in male B6.ERα+/+, B6.ERα-/-, B6.Sle1b.ERα+/+, and B6.Sle1b.ERα-/- mice. Splenocytes were collected from mice that were 5–6 months of age. In (A, C, E), the longer horizontal bar in each panel denotes the mean for each group, and the shorter black bars indicate the standard error of the mean. The ** indicates p ≤ 0.01.

