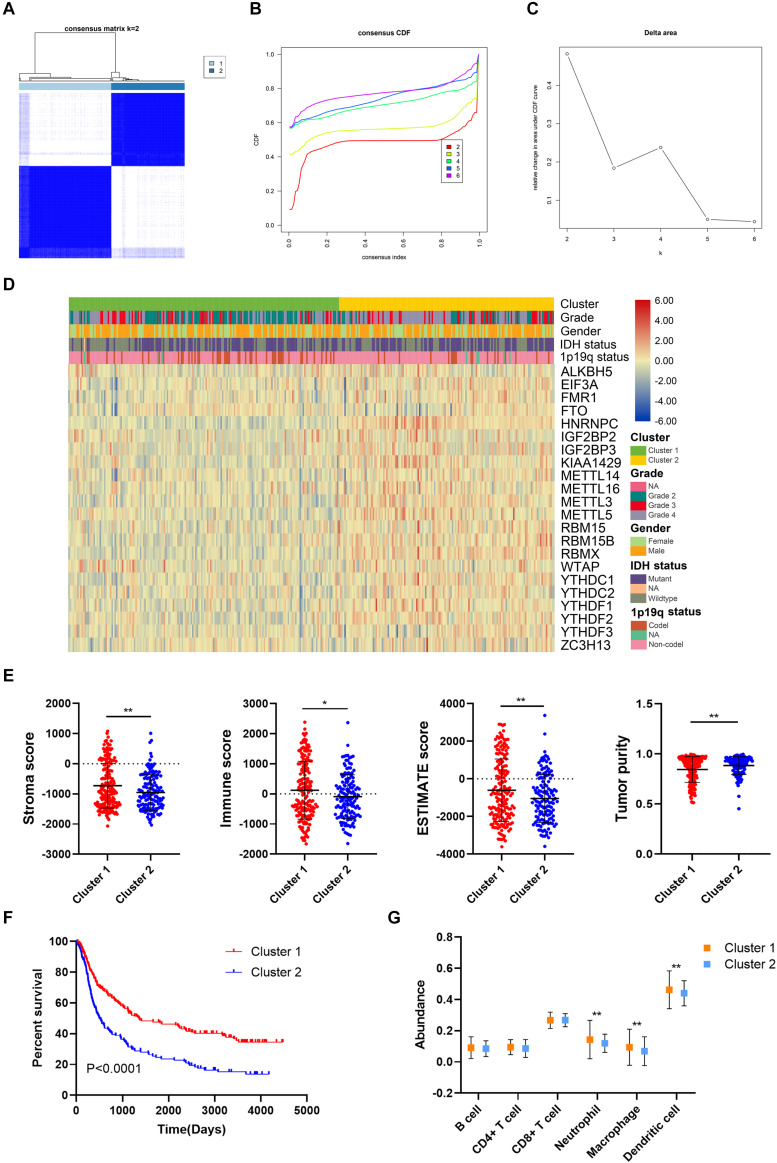
FIGURE 3.
Prognosis and immune infiltrations in consensus clustering subgroups of gliomas. (A) Consensus clustering matrix for k = 2. (B,C) Consensus clustering cumulative distribution function for k = 2–6. (D) Expression pattern of m6A regulators in cluster 1 and cluster 2 subgroups. (E) Stroma, immune, and ESTIMATE scores and tumor purity in cluster 1 and cluster 2 subgroups. (F) Kaplan–Meier analysis of patients in cluster 1 and cluster 2 subgroups. (G) The abundance of six immune cells in cluster 1 and cluster 2 subgroups. *p < 0.05; **p < 0.01.

