FIGURE 5.
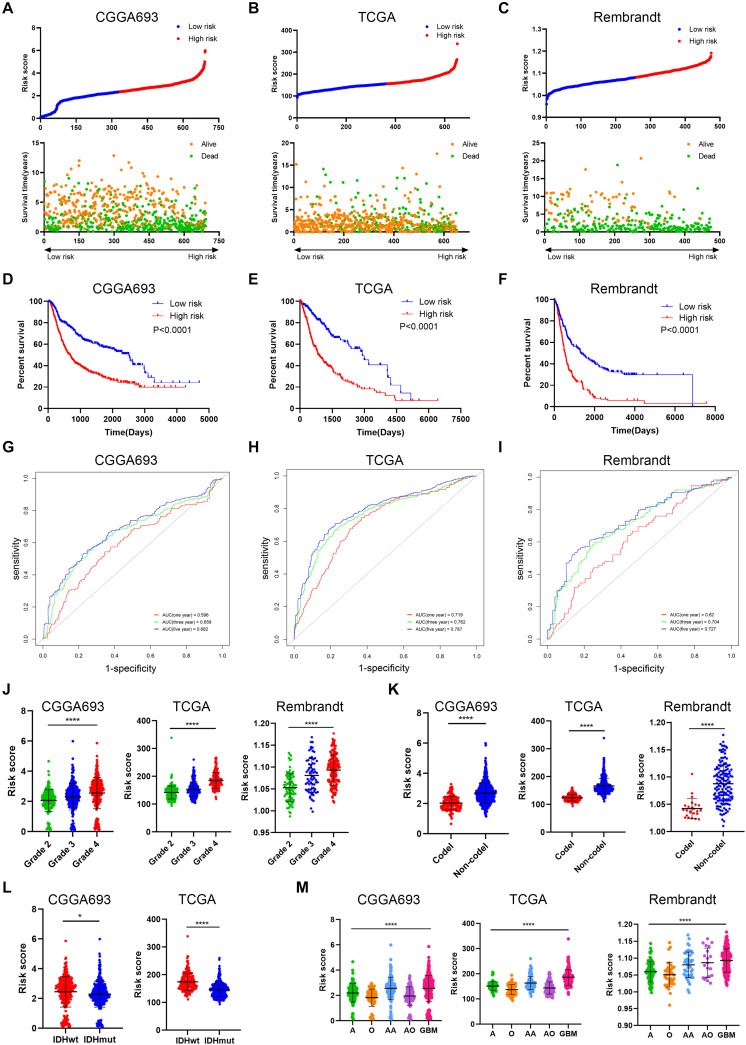
Verification of risk signature of glioma features in the validation cohort. (A–C) Risk score of each patient in the three datasets. (D–F) Kaplan–Meier analysis of patients in the high risk and low risk groups in the three datasets. (G–I) Time-dependent ROC analysis of risk score in predicting prognoses in the three datasets. (J) Risk score of different grades of glioma in the three datasets. (K) Risk score of 1p19q codeletion and non-codeletion gliomas in the three datasets. (L) Risk score of IDH wild-type and IDH mutant gliomas in CGGA693 and TCGA datasets. (M) Risk score of different histological subtypes of glioma in the three datasets. ROC, receiver operating characteristic. *p < 0.05; ****p < 0.0001.

