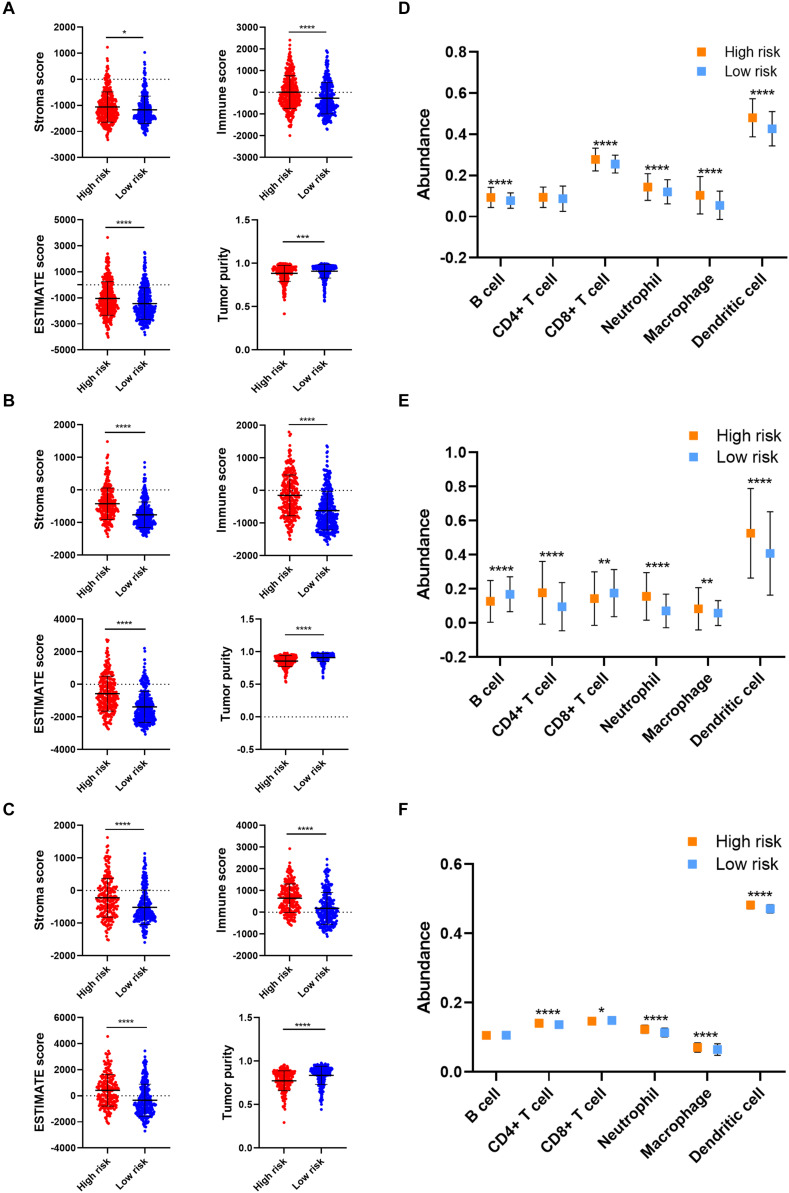
FIGURE 6.
Verification of risk signature of glioma immune microenvironment in the validation cohort. (A–C) Stroma, immune, and ESTIMATE scores and tumor purity in the high risk and low risk groups in CGGA693 (A), TCGA (B), and Rembrandt (C) datasets. (D–F) The abundance of six immune cells in the high risk and low risk groups in CGGA693 (D), TCGA (E), and Rembrandt (F) datasets. *p < 0.05; **p < 0.01; ***p < 0.001; ****p < 0.0001.

