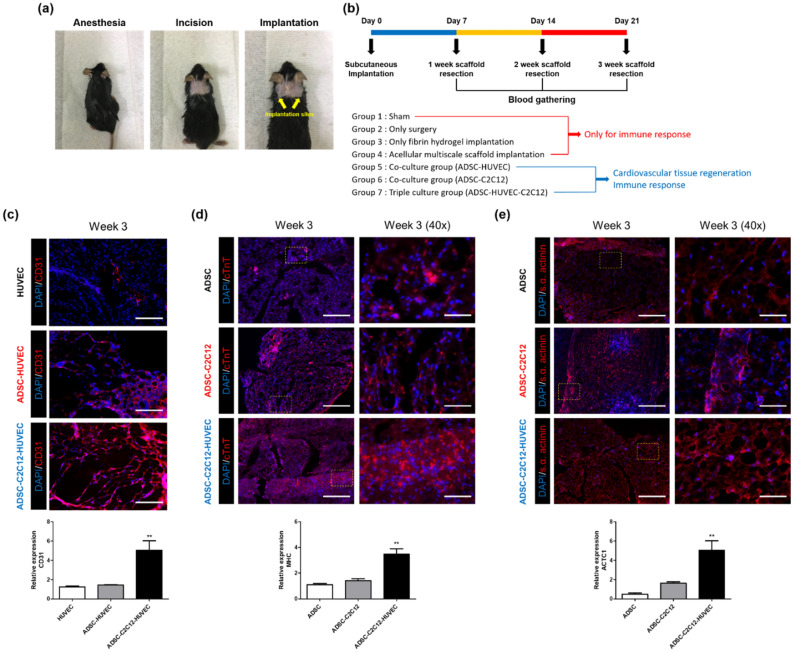
Figure 6.
Cardiovascular tissue regeneration capacity of cell-laden multiscale scaffolds after subcutaneous implantation. (a) Photos showing the experimental procedure for in vivo studies. (b) Description of experimental design for in vivo studies. Immunofluorescence images and qRT-PCR results for (c) CD31, (d) cTNT, and (e) s.α. actinin. Scale bar = 200 μm and 50 μm for low magnification images and high magnification images, respectively. Data are mean ± s.d. One-way ANOVA with Tukey’s post-hoc test was used, compare to ADSC and HUVEC monocultured group, respectively. ***P < 0.001, **P < 0.01.

