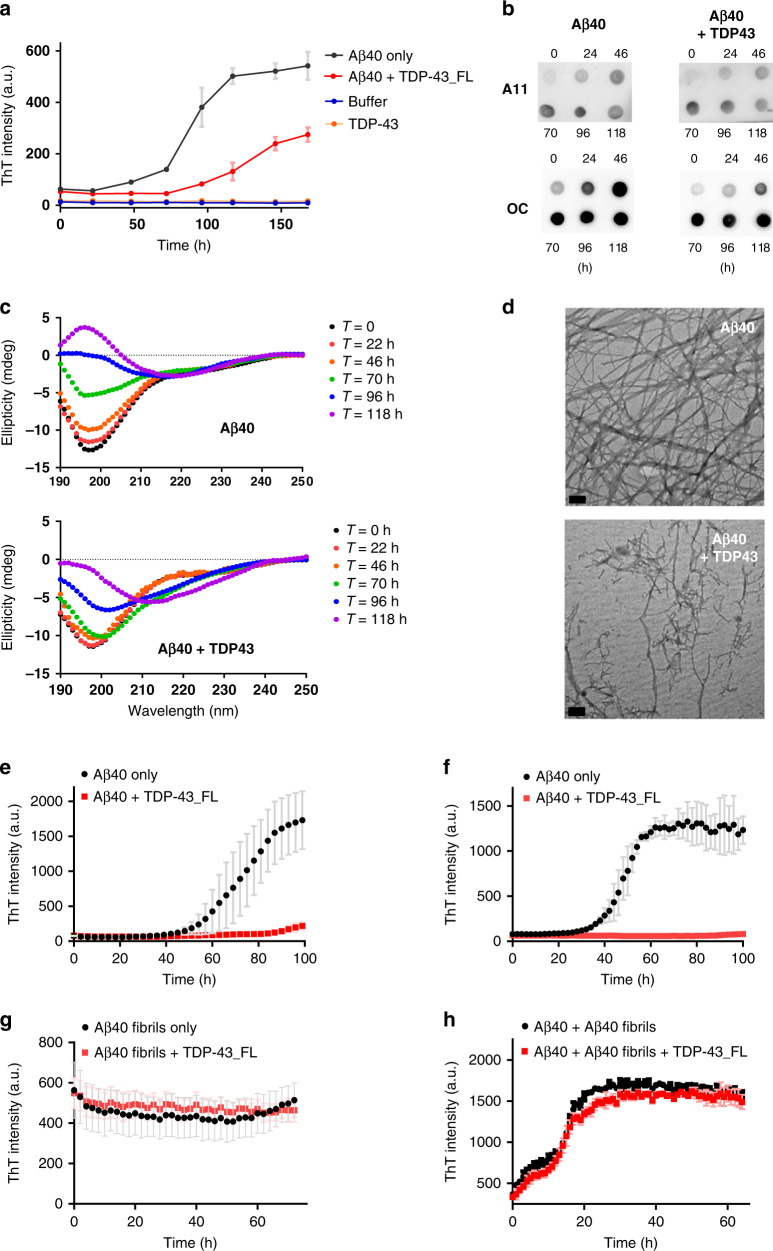
Fig. 1. TDP-43 inhibits Aβ fibrillization at initial and oligomer stages of Aβ.
a Fibrillization kinetics of Aβ40 (black) and Aβ40 with TDP-43 (red) monitored by ThT assay in 10 mM Tris buffer, pH 8.0. TDP-43 alone (orange) and buffer alone (blue) are also shown. The averaged data from three replicates and standard deviations are plotted. Aβ40 concentration was 25 μM and TDP-43 concentration was 0.25 μM. b Dot blotting of the time point samples by anti-amyloid oligomers A11 antibody and anti-amyloid fibrils OC antibody. c Far-UV CD spectra of Aβ40 in the absence and presence of TDP-43_FL after 0 (black), 22 (red), 46 (orange), 70 (green), 96 (blue), and 118 (purple) h incubation. The buffer control and TDP-43 background were subtracted. d TEM images of the end-point product of Aβ40 alone in ThT assay, and the end-point product of Aβ40 with TDP-43. The scale bars are 100 nm. Two times of independent experiments were performed. e–h Fibrillization kinetics of Aβ40 from different stages with and without full-length TDP-43. Aβ40 monomer (e), Aβ40 oligomers (f), Aβ40 fibrils (g), and Aβ40 monomer in the presence of 10% fibril seeds (h) were incubated with (red) and without full-length TDP-43 (black) and monitored by ThT assay in 10 mM Tris buffer, pH 8.0. Aβ40 concentration was 25 μM, and TDP-43 concentration was 0.25 μM. Aβ fibril seeds were prepared from sonicated Aβ40 fibrils at 25 μM. The averaged data from three replicates and standard deviations are plotted. Source data are provided as a Source Data file.

