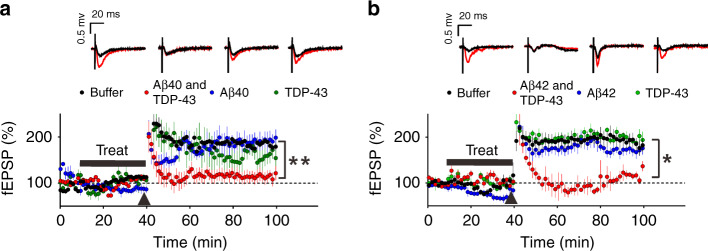
Fig. 4. TDP-43-induced Aβ species impairs the hippocampus LTP.
Field EPSPs (fEPSPs) were measured from a Schaffer collateral fiber on a hippocampal slice from C57BL/6 mice. After the recording was stabilized for 10 min, the slices were treated with buffer, Aβ with TDP-43, Aβ alone, or TDP-43 alone for 30 min. After the treatment, the hippocampal slices were subjected to a theta burst stimulation (black arrowhead) to induce LTP. Scale bar, 0.5 mv, 20 ms. The averaged data and s.e.m. are plotted and colored for buffer control (black), Aβ and TDP-43 (red), Aβ (blue), and TDP-43 (green). Each group of fEPSPs before (black line) and after (red line) the theta burst stimulation is shown individually in the upper panel. a For Aβ40 analysis, Aβ40 at 1 µM and TDP-43 at 10 nM were used. The slices were treated with buffer (n = 4 independent slices), Aβ40 with TDP-43 (n = 3, independent slices), Aβ40 alone (n = 4, independent slices), or TDP-43 alone (n = 4, independent slices). TDP-43 + Aβ40 vs. buffer; repeated two-way ANOVA, p = 0.0032, **p < 0.01. b For Aβ42 analysis, Aβ42 at 62.5 nM and TDP-43 at 0.625 nM were used. The slices were treated with buffer (n = 9 independent slices), Aβ42 with TDP-43 (n = 4, independent slices), Aβ42 alone (n = 5, independent slices), or TDP-43 alone (n = 5, independent slices). TDP-43 + Aβ42 vs. buffer; repeated two-way ANOVA, p = 0.0232, *p < 0.05. Source data are provided as a Source Data file.

