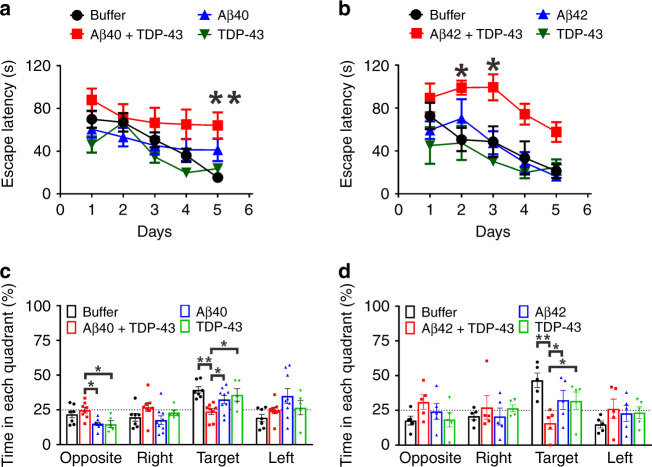
Fig. 5. TDP-43-induced Aβ species impairs hippocampus-related spatial memory to a greater degree than Aβ or TDP-43 alone does in the injected mouse model.
WT mice at the age of 5-month were intracranially injected with the samples from the aggregation assays. Aβ, TDP-43, Aβ with TDP-43, and buffer obtained from the aggregation reaction were used. Spatial learning and memory functions were inspected by MWM 1 month after injection. Escape latency is defined as the time at which the hidden platform is found. The data were colored for buffer control (black), Aβ and TDP-43 (red), Aβ (blue), and TDP-43 (green). a Training phase for Aβ40. The sample sizes for buffer, Aβ40 with TDP-43, Aβ40, and TDP-43 are 7, 8, 9, and 5, respectively. The averaged data and s.e.m. are plotted. The statistical analysis was performed by repeated two-way ANOVA and Bonferroni’s post-hoc test, **p < 0.01 (Buffer vs. Aβ40 + TDP-43 at day 5, p = 0.0048). b Training phase for Aβ42. The sample size for buffer, Aβ42 with TDP-43, Aβ42, and TDP-43 are 5, 4, 4, and 5, respectively. The averaged data and s.e.m. are plotted. The statistical analysis was performed by repeated two-way ANOVA and Bonferroni’s post-hoc test, *p < 0.05 (Buffer vs. Aβ42 + TDP-43 at day 2, p = 0.0174; Buffer vs. Aβ42 + TDP-43 at day 3, p = 0.0112). c Probe test for Aβ40. The time in each quadrant were calculated in percentage. The averaged data and s.e.m. are plotted. The statistical analysis was performed by one-way ANOVA, Holm-Sidak’s multiple comparisons, *p < 0.05, **p < 0.01 (In the opposite quadrant: Aβ40 + TDP-43 vs. Aβ40, p = 0.0147; Aβ40 + TDP-43 vs. TDP-43, p = 0.038; In the target quadrant, Buffer vs. Aβ40 + TDP-43, p = 0.002; Aβ40 + TDP-43 vs. Aβ40, p = 0.0425; Aβ40 + TDP-43 vs. TDP-43, p = 0.0289). d Probe test for Aβ42. The averaged data and s.e.m. are plotted. The statistical analysis was performed by one-way ANOVA, Holm-Sidak’s multiple comparisons, *p < 0.05, **p < 0.01 (In the target quadrant: Buffer vs. Aβ42 + TDP-43, p = 0.0019; Aβ42 + TDP-43 vs. Aβ42, p = 0.0311; Aβ42 + TDP-43 vs. TDP-43, p = 0.0311). Source data are provided as a Source Data file.

