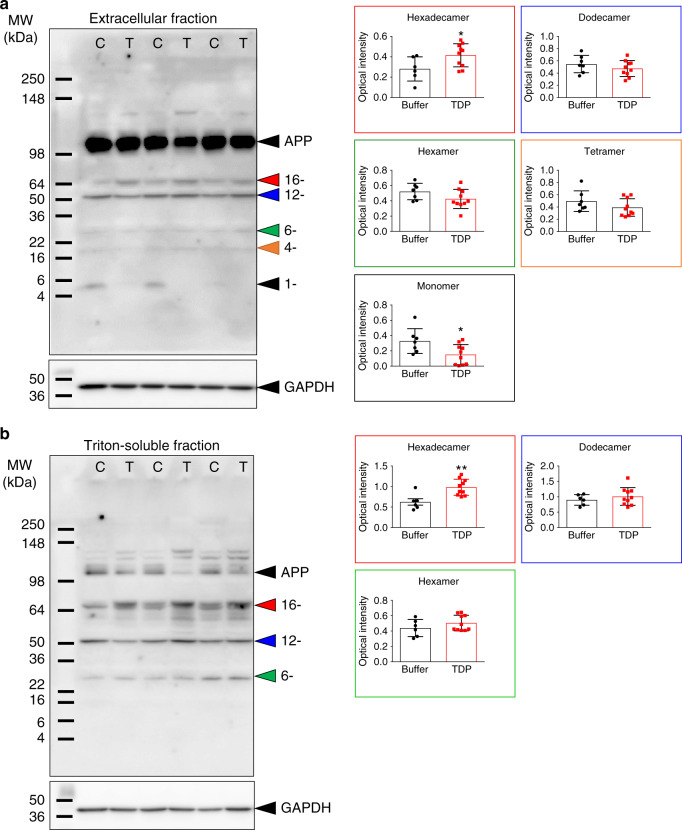
Fig. 7. TDP-43 alters Aβ assembly in APP/PS1ΔE9 mice.
Representative western blot of a extracellular-enriched and b Triton-soluble fraction of TDP-43-injected or buffer-injected APP/PS1ΔE9 mice brain. Aβ was detected and quantified in different assembles. TDP-43 group is denoted as T, and the buffer group is denoted as C. The quantitative results of each Aβ assembly in TDP-43-injected (n = 6) or buffer-injected (n = 10) APP/PS1ΔE9 mice were shown on the right panels. The averaged data and s.e.m. are plotted. The statistical analysis was performed by two-tailed Mann–Whitney test, *p < 0.05, **p < 0.01 (for extracellular-enriched fraction, Hexadecamer: Buffer vs. TDP-43, p = 0.042; Monomer: Buffer vs. TDP-43, p = 0.043; For Triton-soluble fraction, Hexadecamer: Buffer vs. TDP-43, p = 0.005). Source data are provided as a Source Data file.

