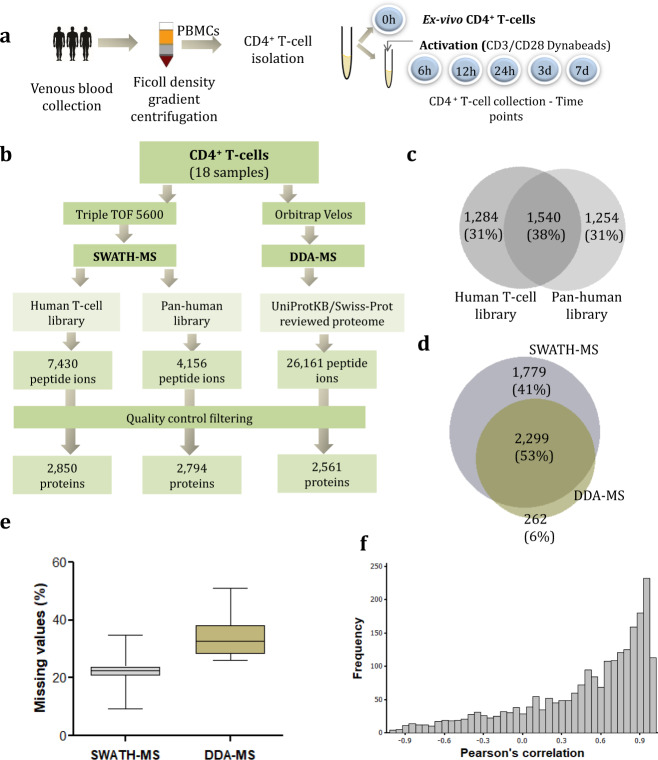
Fig. 3.
SWATH-MS data analysis against human T-cell and Pan human libraries and comparison with DDA-MS data. (a) Experimental protocol used to obtain human CD4+ T-cells at different in vitro activated status. Samples were obtained from three different donors. (b) Number of peptides and proteins detected by the analysis of CD4+ T-cells by SWATH-MS against human T-cell and pan-human spectral libraries and DDA-MS. (c) Proportional Venn diagram depicting the overlap between quantified SWATH-MS proteins against the two spectral libraries. (d) Proportional Venn diagram depicting the overlap between all the quantified SWATH-MS proteins and DDA-MS proteins. (e) Box plots showing the missing peptide intensity values in SWATH-MS and DDA-MS data (central lines and boxes represent means and 95% confidence intervals respectively while whiskers are 2.5 to 97.5 percentiles). (f) Distribution of Pearson correlation coefficient between protein expression data obtained by SWATH-MS and DDA-MS for human CD4+ T-cell time series experiment.

