
Figure 6.
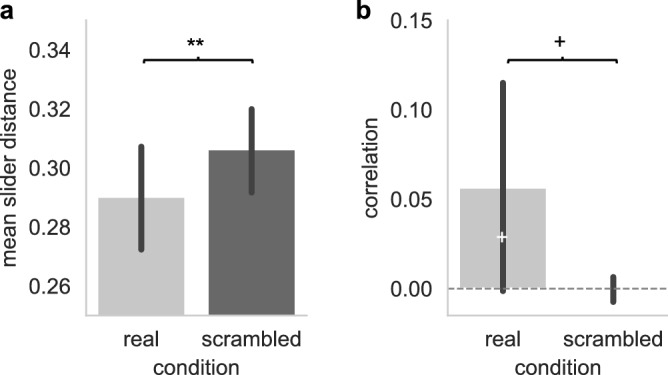
Coordination of directional intentions. (A) The degree of congruence between pairs of musicians’ directional intentions was measured as the average distance between slider values. Mean slider distance for real pairs highly significantly differed from mean slider distances computed over time-scrambled pairs (t(65) = 2.98, p = 0.004, d = 0.25), indicating that musicians’ directional intentions were closer to each other than would be predicted by chance. (B) Correlations (Pearson’s rho) only marginally differed from the chance-level computed from scrambled pairs (t(65) = 1.86, p = 0.067, d = 0.33) and from zero (t(65) = 1.85, p = 0.068, d = 0.23), with a small effect size reflecting the fact that some pairs tended to be correlated, and other pairs to be anti-correlated. Error bars show 95% confidence intervals, black asterisks show the pairwise t-test comparing real vs. scrambled data (with **p < 0.01; +p < 0.07) and white asterisks the one-sample t-tests comparing Pearson’s rho to zero (with +p < 0.07).