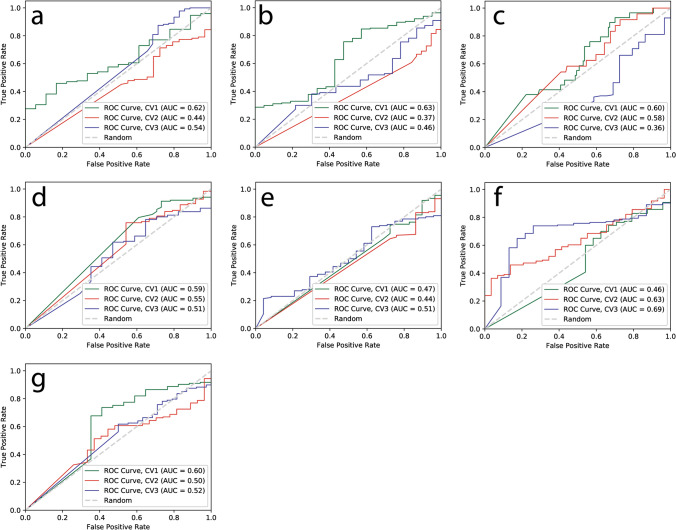
Figure 1.
ROC curves for VGG16 deep learning models with each MRI sequence for prediction of PsP from TP. Each ROC curve for each modality obtained from threefold cross-validation (CV1, CV2, and CV3). The x-axis is the true negative rate (TNR) or specificity and the y-axis is true positive rate (TPR) or sensitivity. The mean AUC, area under ROC curve, values were (a) 0.53 for pre T1-weighted, (b) 0.49 for post T1-weighted, (c) 0.51 for T2-weighted, (d) 0.55 for FLAIR, (e) 0.47 for ADC map, (f) 0.59 for post T1–pre T1, (g) 0.54 for T2–FLAIR images.

