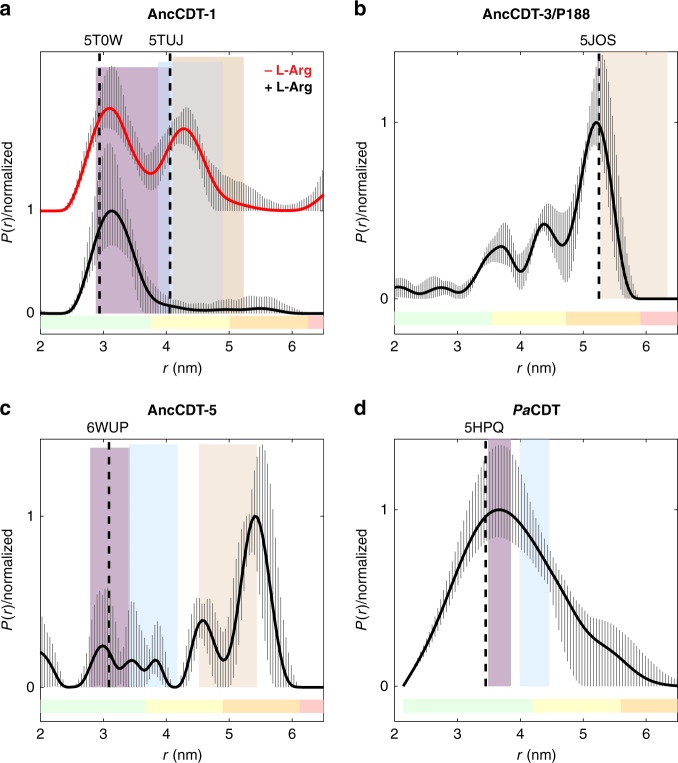
Fig. 3. Solution dynamics of AncCDT-1, AncCDT-3/P188, AncCDT-5 and PaCDT probed by DEER.
Gd(III)–Gd(III) distance distributions for samples of propargyl-DO3A-Gd(III)-tagged a refolded AncCDT-1 (-/+ L-Arg, tagged at positions 68 and 138), b natively purified AncCDT-3/P188 (tagged at positions 68 and 138), c natively purified AncCDT-5 (tagged at positions 68 and 138) and d natively purified PaCDT (tagged at positions 68 and 139 and diluted by a factor of 10 using unlabelled PaCDT). Distance distributions were obtained using DeerAnalysis77; the solid lines represent the distributions with the best r.m.s.d. from the experimental data, and the striped regions represent the variation of alternative distributions (± 2 times the standard deviation) obtained by varying the parameters of the background correction and noise. The coloured bars at the bottom of each panel reflect the reliability of each region of the distribution, corresponding to the DEER evolution time used, as defined in DeerAnalysis (pale green: the shape of the distance distribution is reliable; pale yellow: the mean distance and distribution width are reliable; pale orange: the mean distance is reliable; pale red: long-range distance contributions may be detectable, but cannot be quantified.). The original DEER data and DEER form factor traces are shown in Supplementary Figs. 5, 7 and 8. Vertical dashed lines represent the Gd(III)–Gd(III) distances estimated by modelling propargyl-DO3A-Gd(III) tags onto the crystal structures of each protein. The shaded areas represent the range of calculated Gd(III)–Gd(III) distances when propargyl-DO3A-Gd(III) tags are modelled onto a number of individual MD snapshots representing the closed (magenta), open (blue) and wide-open (orange) states.

