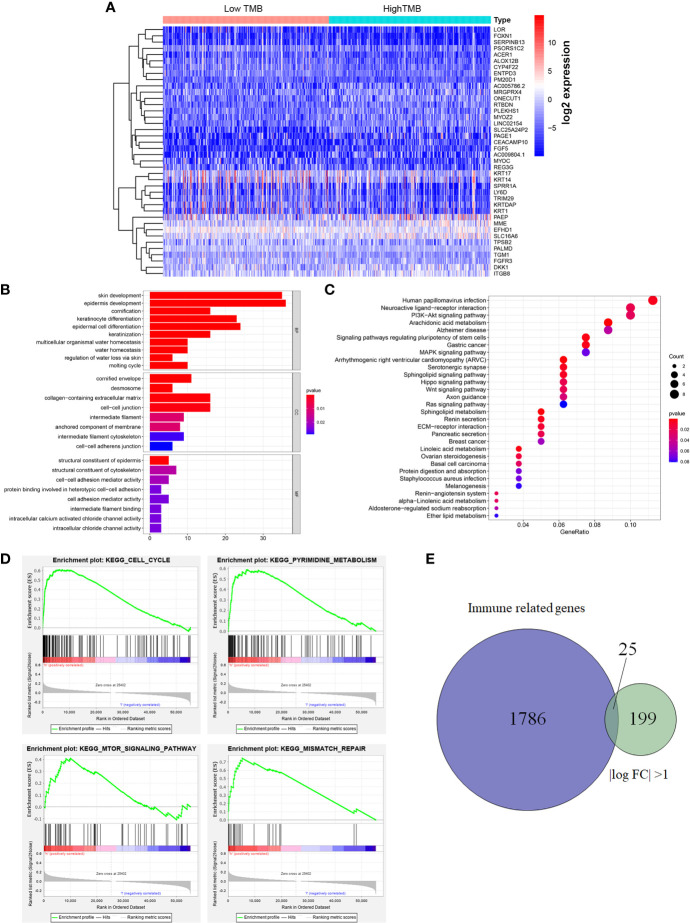
Figure 3.
Differential analysis of gene expression profiles in high- and low-TMB groups and enrichment pathway analysis. (A) Heatmap of top 40 DEGs was drawn to reveal different distribution of expression state, where the colors of blue to red represented alterations from low expression to high expression. (B, C) GO and KEGG enriched results revealed that these differentially genes might be related to skin development, epidermis development, cell differentiation crosstalk, and multiple cancer-related crosstalk. (D) GSEA showed the top TMB-related crosstalk, including cell cycle, pyrimidine metabolism, mTOR signaling pathway, and mismatch repair with FDR <0.25. (E) TMB-related immune genes were identified through the intersection of immune related genes and DEGs between high- and low-TMB group with |log FC| >1. TMB, tumor mutation burden; DEGs, differentially expressed genes; GO, Gene Ontology; KEGG, Kyoto Encyclopedia of Genes and Genomes; GSEA, gene set enrichment analysis; FC, fold change; BP, biological process; CC, cell component; MF, molecular function.

