
Figure 5.
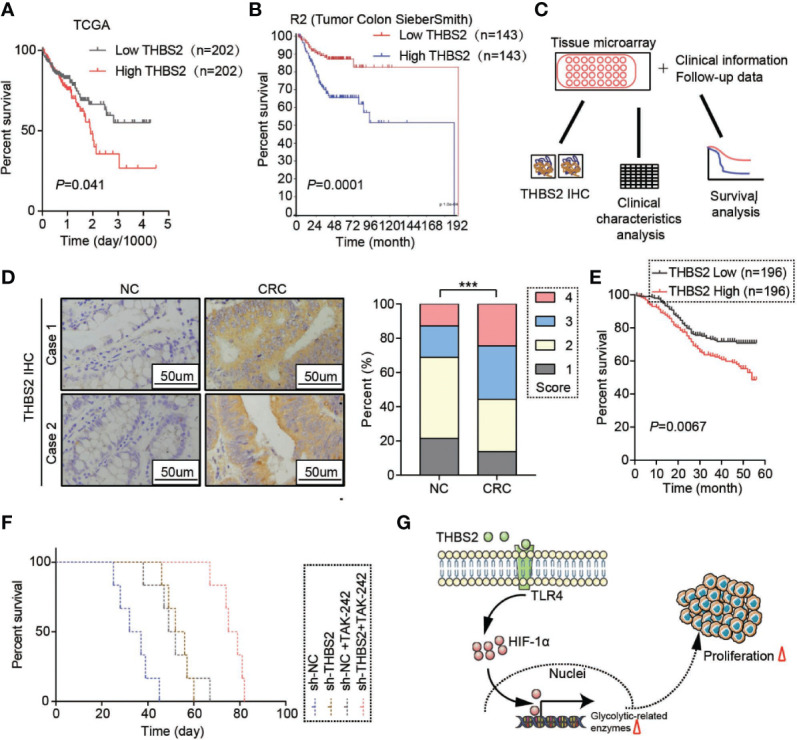
THBS2 is a potential therapeutic target for CRC. (A) Overall survival analysis based on the mRNA expression of THBS2 from the TCGA dataset. (B) Overall survival analysis based on the mRNA expression of THBS2 from the TCGA dataset. (C) Analysis of the protein expression of THBS2 in tissue microarray, linked to clinical information and follow-up data. (D) The protein expression of THBS2 in a CRC tissue microarray (392 cases of paired CRC and adjacent non-cancerous tissues) by IHC. (E) Overall survival analysis of the protein expression of THBS2, based on the prognostic information of patients with CRC from tissue microarray data. (F) Overall survival of the tumor-bearing null mice in the sh-NC, sh-THBS2, sh-NC+TAK-242, and sh-THBS2+TAK-242 group. (G) THBS2 interacted with TLR4, which enhanced aerobic glycolysis, and eventually contributed to CRC progress. Measurement data are presented as the mean ± SD. Student’s t-test was used for statistical analysis. The Kaplan–Meier method and log-rank test were used for statistical analysis. Spearman’s rank correlation was used to analyze the correlation between THBS2 expression and pathological staging; ***p < 0.001.