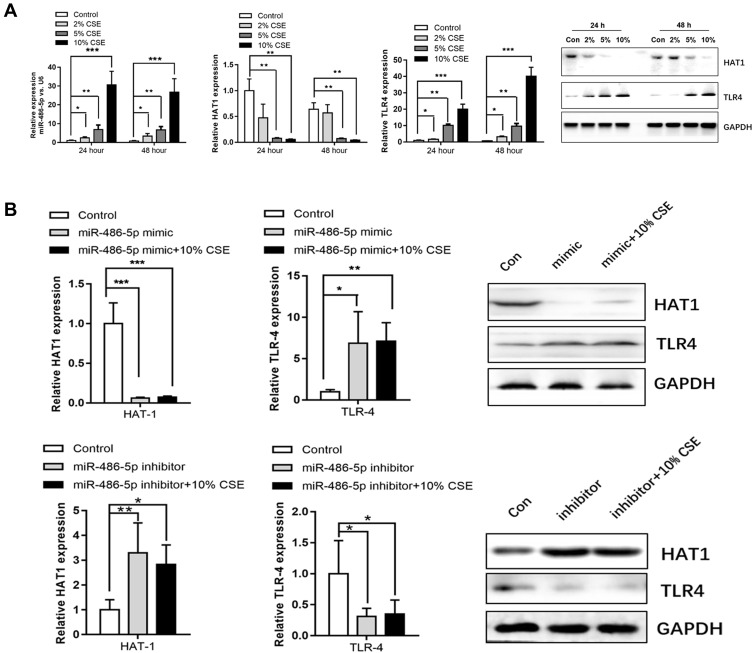
Figure 5.
Associations among miR-486-5p, HAT1, and TLR4 expression. (A) Expression levels of miR-486-5p, HAT1, and TLR4 in 2%, 5%, and 10% CSE-treated NR8383 cells, determined using qPCR and Western blotting. (B) HAT1 and TLR4 expression after the overexpression or inhibition of miR-486-5p. *P < 0.05; **P < 0.01; ***P < 0.001.

