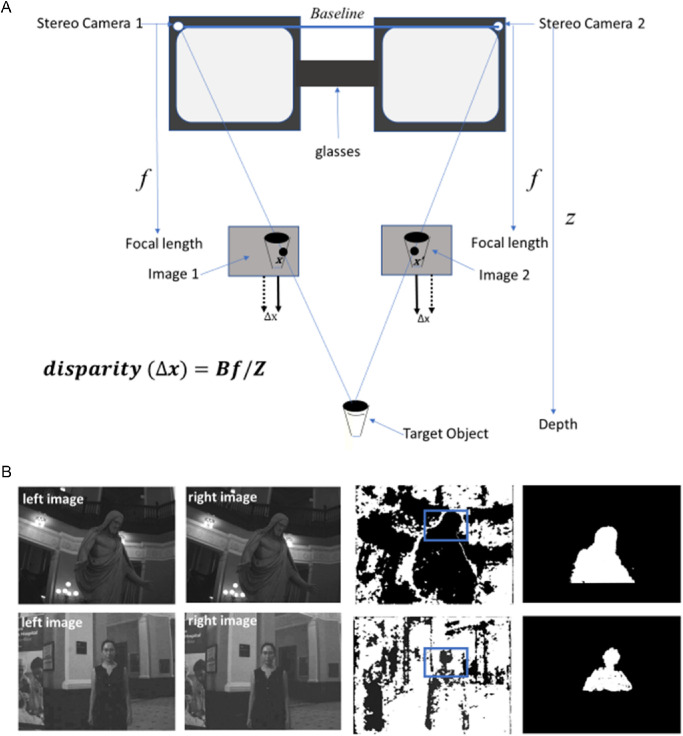
Figure 1.
(A) Schematic of the stereo disparity system. (B) Example of images from the stereo camera system and the corresponding disparity maps. The first two images on the left are from the left and right cameras, respectively, and the third image shows the disparity map. The blue rectangle shows the field of view of the system and the fourth image is the corresponding filtered image.

