FIGURE A1.

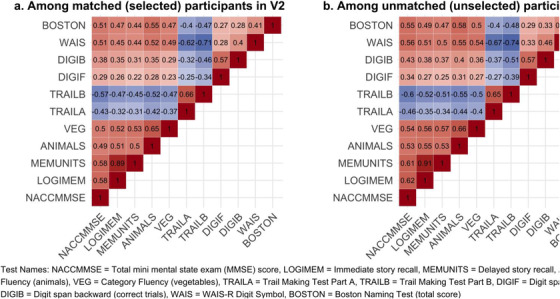
Correlation metrics of cognitive test scores among those who were selected (matched with V3) versus those who were not selected

Correlation metrics of cognitive test scores among those who were selected (matched with V3) versus those who were not selected